Fig. 4
Download original image
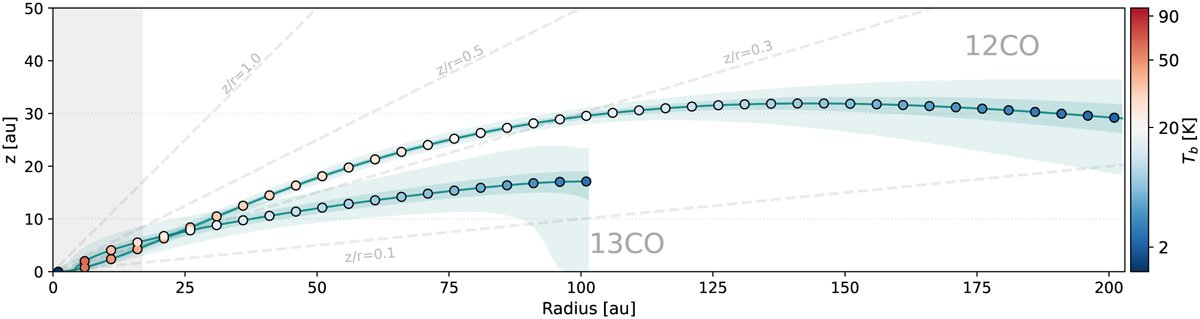
Height of the surface emitting layer for the 12CO and 13CO of MHO 6. The darker and lighter shaded regions surrounding each profile represent the 1σ and 3σ confidence levels, respectively. The grey shaded region on the left shows the spatial extent of one angular resolution element, as measured from the disk center. The distance in the x−y axis is shown in a 1:1 scale.
Current usage metrics show cumulative count of Article Views (full-text article views including HTML views, PDF and ePub downloads, according to the available data) and Abstracts Views on Vision4Press platform.
Data correspond to usage on the plateform after 2015. The current usage metrics is available 48-96 hours after online publication and is updated daily on week days.
Initial download of the metrics may take a while.