Fig. 3
Download original image
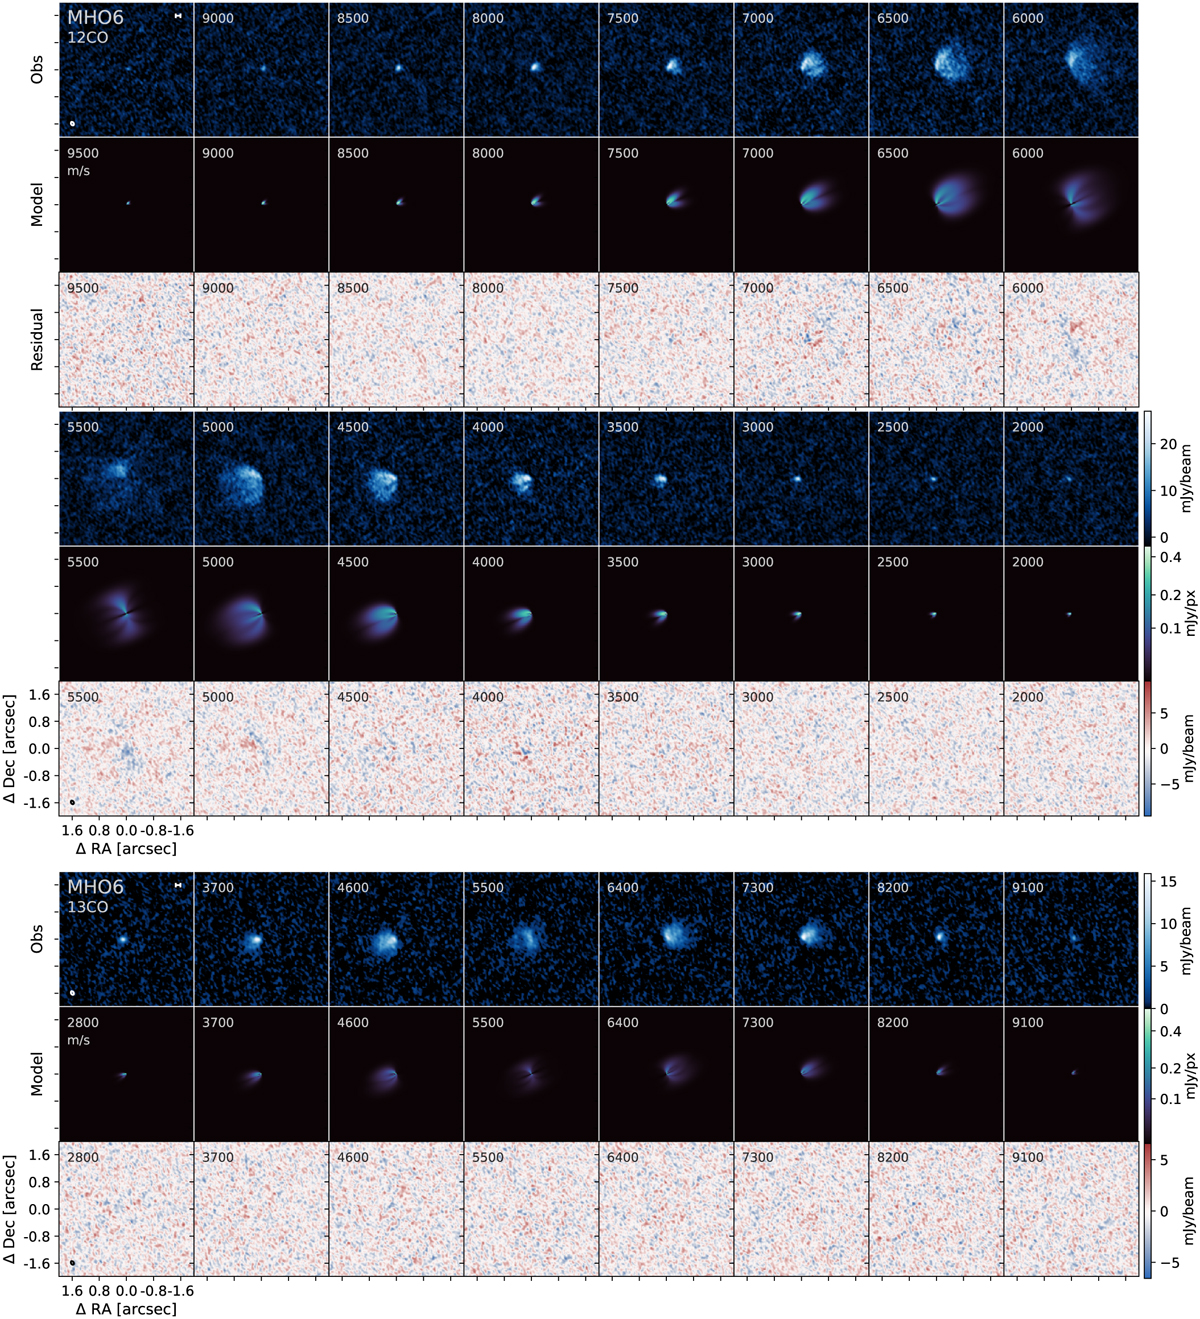
12CO J = 3−2 and 13CO J = 3−2 channel maps. Each row shows the CLEAN image of the observation, the best visibility model, and the image made from the residual visibilities. The scale bar in the upper left panels is 10 au in size, while the beam size is shown in the lower left corner of the first panels. The number in the upper left corner shows the channel velocity relative to the resting frequency of each line, in m s−1.
Current usage metrics show cumulative count of Article Views (full-text article views including HTML views, PDF and ePub downloads, according to the available data) and Abstracts Views on Vision4Press platform.
Data correspond to usage on the plateform after 2015. The current usage metrics is available 48-96 hours after online publication and is updated daily on week days.
Initial download of the metrics may take a while.