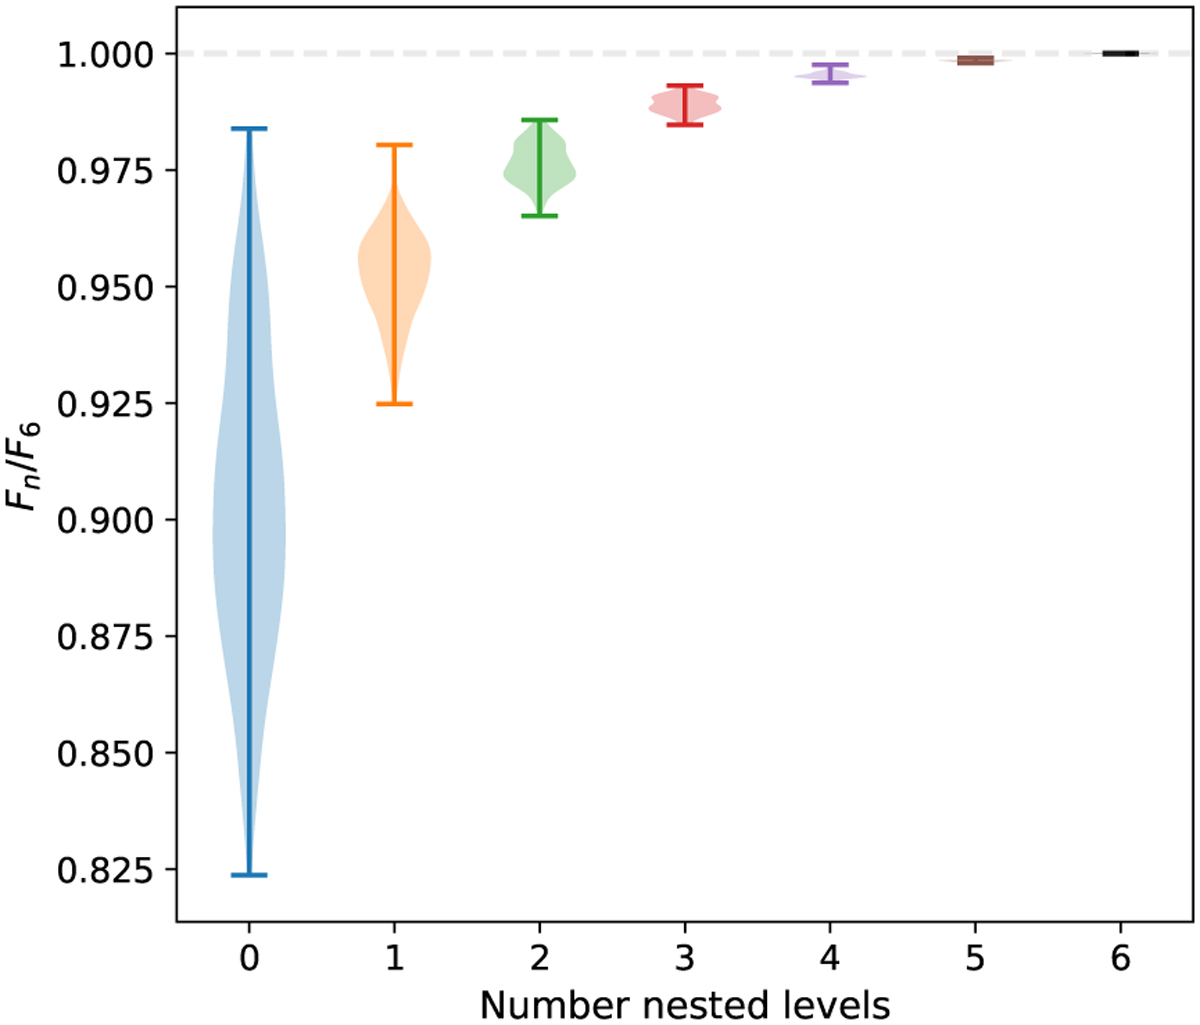
Fig. C.3
Download original image
Distribution of flux ratio between models with different levels of nesting and a model with a nesting of n = 6 as a reference. For each nested level, 256 models where generated by shifting the center of the disk by 1 mas in the RA and Dec grid, covering the full extent of one nominal pixel. For each nested level the width of the shape is representative of the density distribution of the sample.
Current usage metrics show cumulative count of Article Views (full-text article views including HTML views, PDF and ePub downloads, according to the available data) and Abstracts Views on Vision4Press platform.
Data correspond to usage on the plateform after 2015. The current usage metrics is available 48-96 hours after online publication and is updated daily on week days.
Initial download of the metrics may take a while.