Fig. 1
Download original image
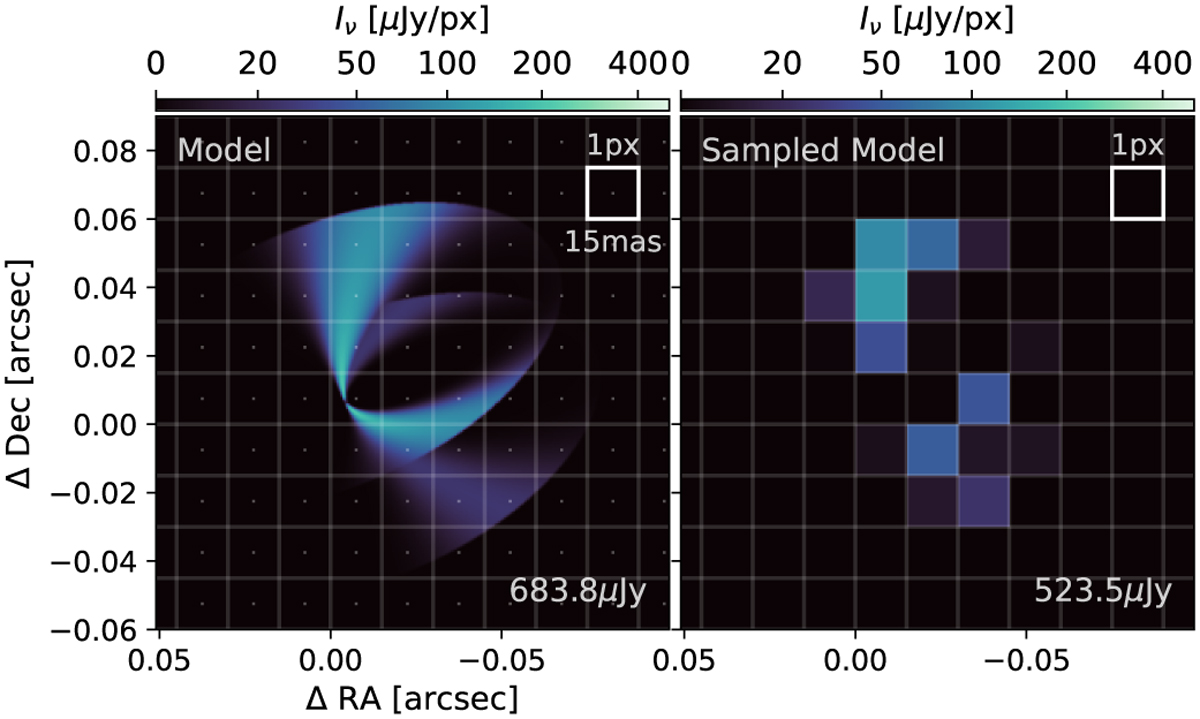
Left panel: image representative of the parametric model for the inner 10 au intensity distribution of a single velocity channel of MHO 6 (centered at 6 km s−1). The total flux from the image is shown in the lower right corner. The white lines represent the pixel grid used to sample the intensity distribution, prior to calculating its visibilities. The white dots show the location of the pixels center. Right panel: sampled model image, where each pixel has the value of the intensity distribution evaluated at the pixel center. Each pixel is 15 mas per side, close to 2 au at the distance of MHO 6. Due to an incomplete intensity sampling, the total flux is underestimated.
Current usage metrics show cumulative count of Article Views (full-text article views including HTML views, PDF and ePub downloads, according to the available data) and Abstracts Views on Vision4Press platform.
Data correspond to usage on the plateform after 2015. The current usage metrics is available 48-96 hours after online publication and is updated daily on week days.
Initial download of the metrics may take a while.