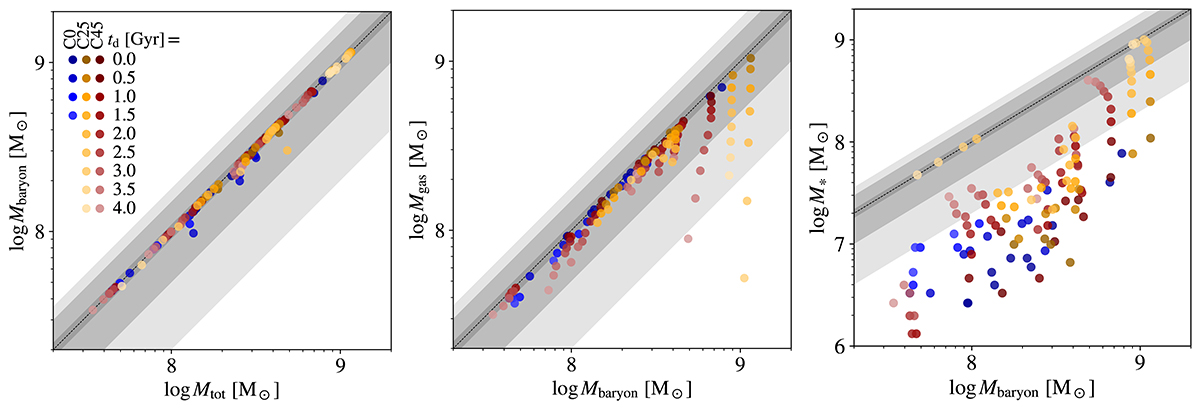
Fig. 6.
Download original image
Baryon mass Mbaryon vs. total mass Mtot (left), gas mass Mgas vs. baryon mass Mbaryon (middle), and stellar mass M* vs. baryon mass Mbaryon (right) of stripped tidal dwarf galaxies. The blue, orange and red colors represent the C0, C25 and C45 orbit scenarios, respectively. Values at the beginning of the tracing are shown in dark colors, while their evolution within 4 Gyr with time steps of 0.5 Gyr is indicated by consecutively lighter shades. The dashed black line indicates the 1:1 relationship, while the gray regions represent a 10%, 50%, and 80% decline from it.
Current usage metrics show cumulative count of Article Views (full-text article views including HTML views, PDF and ePub downloads, according to the available data) and Abstracts Views on Vision4Press platform.
Data correspond to usage on the plateform after 2015. The current usage metrics is available 48-96 hours after online publication and is updated daily on week days.
Initial download of the metrics may take a while.