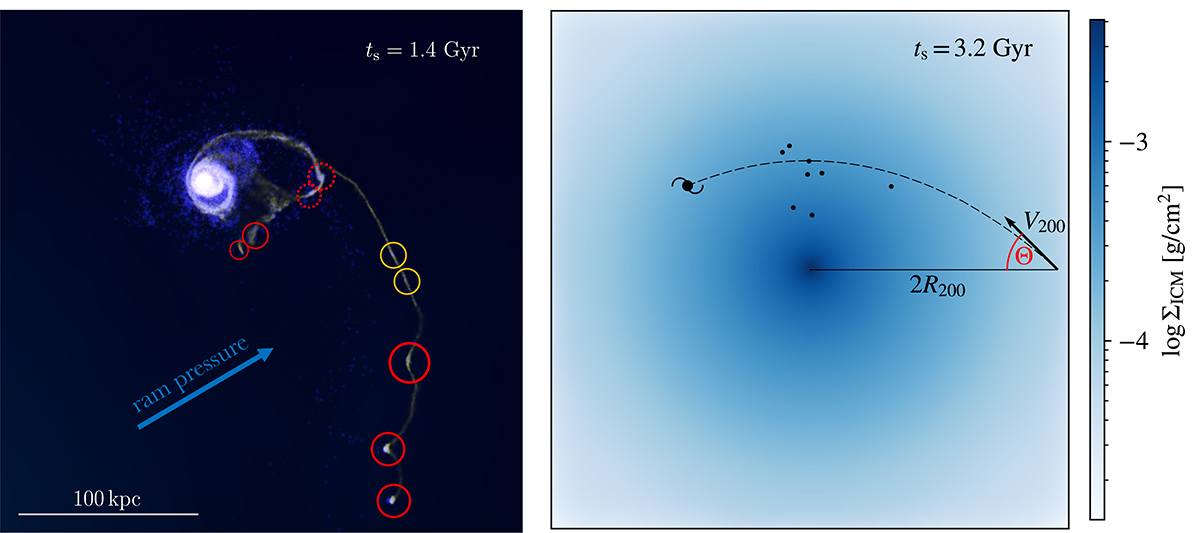
Fig. 3.
Download original image
Emergence of tidal dwarf galaxies in galaxy clusters. Left: Simulated galaxy merger in a cluster (C45) 1.4 Gyr after the beginning of the simulation. Gas and young stars are rendered in yellow and light blue, respectively, using the raytracing visualization software Splotch (Dolag et al. 2008). Circles highlight star forming pockets, which either fall back into the merger (dashed), or managed to escape the local gravitational potential (solid), while orange circles mark two dwarfs which coincidentally merge after the stripping event. The associated movie, showing the merger and the stripping process of tidal dwarf galaxies, is available online. Right: Spatial distribution of stripped tidal dwarfs (black dots) formed by the galaxy merger 3.2 Gyr after the beginning of the simulation. The dashed line traces the trajectory of the galaxy pair, while the blue background indicates the integrated surface density of the ICM in the plotted plane.
Current usage metrics show cumulative count of Article Views (full-text article views including HTML views, PDF and ePub downloads, according to the available data) and Abstracts Views on Vision4Press platform.
Data correspond to usage on the plateform after 2015. The current usage metrics is available 48-96 hours after online publication and is updated daily on week days.
Initial download of the metrics may take a while.