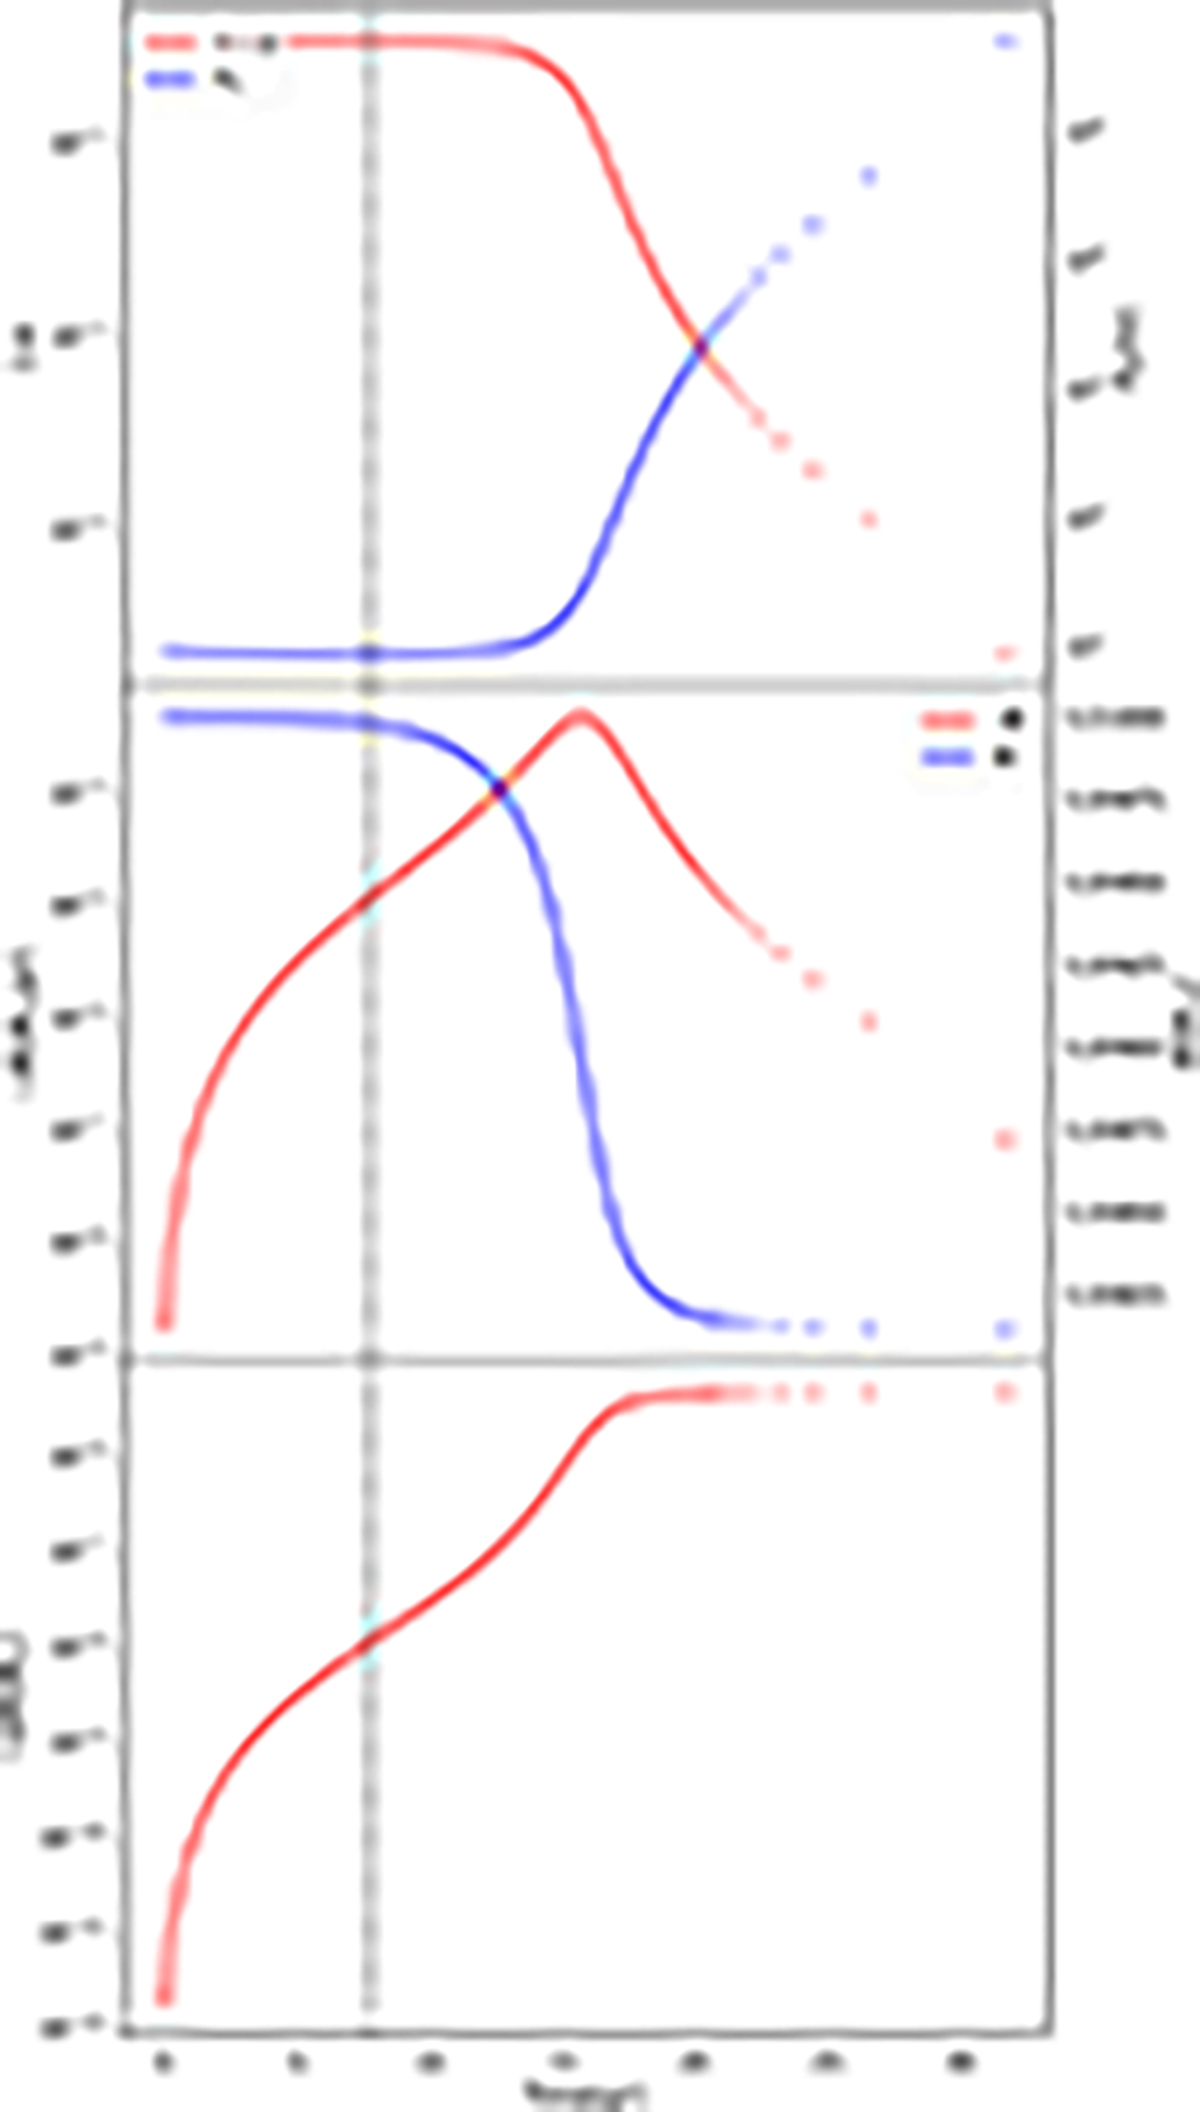
Fig. 1.
Download original image
Evolution of orbit parameters and WD’s mass. The first panel from top to bottom shows the evolution of 1 − e and orbital period Pb. The second one is the evolution of the average mass transfer rate and mass of the WD. And the last one represents the evolution of mass loss at periastron. The dashed line represents the critical time that the effect of the mass transfer becomes dominant. For each parameter, the critical times are not the same but very close. Here we use the critical time of e for all panels. The last ten orbits are plotted as scatter plots and the rest as line plots.
Current usage metrics show cumulative count of Article Views (full-text article views including HTML views, PDF and ePub downloads, according to the available data) and Abstracts Views on Vision4Press platform.
Data correspond to usage on the plateform after 2015. The current usage metrics is available 48-96 hours after online publication and is updated daily on week days.
Initial download of the metrics may take a while.