Fig. 4
Download original image
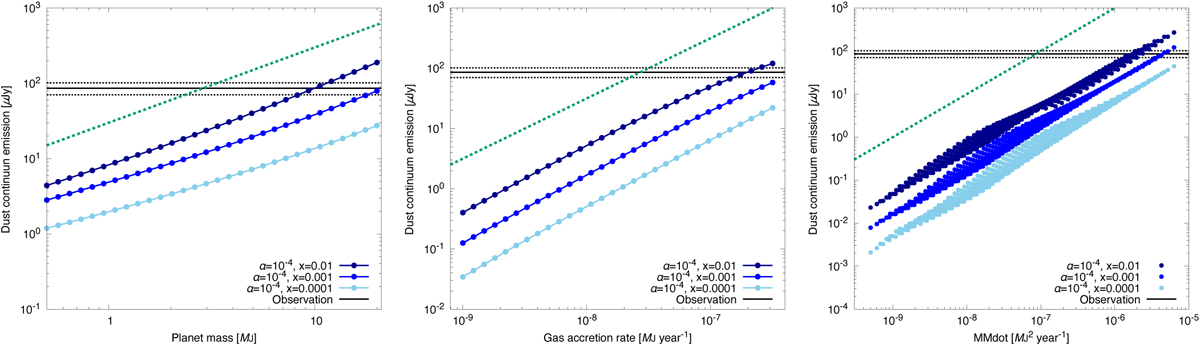
Dust continuum emission from the CPDs of PDS 70 c. The dark-blue, blue, and sky-blue curves represent the results when the dust-to-gas mass ratio in the gas inflow is x = 0.01, 0.001, and 0.0001, respectively. The strength of turbulence in the CPDs is fixed as α = 10−4. The horizontal lines represent the observed value, 86 ± 16 μJy (Benisty et al. 2021). The left, central, and right panels represent the dependence on the planet mass, gas accretion rate, and MMdot, respectively. (Left) The gas accretion rate is fixed as ![]() . The green dotted lines represent the slopes of
. The green dotted lines represent the slopes of ![]() . (Centre) The planet mass is fixed as Mpl = 10 MJ. The green lines are Femit ∝ Mpl. (Right) Both of the planet mass and the gas accretion rate are changed. The green lines are
. (Centre) The planet mass is fixed as Mpl = 10 MJ. The green lines are Femit ∝ Mpl. (Right) Both of the planet mass and the gas accretion rate are changed. The green lines are ![]() .
.
Current usage metrics show cumulative count of Article Views (full-text article views including HTML views, PDF and ePub downloads, according to the available data) and Abstracts Views on Vision4Press platform.
Data correspond to usage on the plateform after 2015. The current usage metrics is available 48-96 hours after online publication and is updated daily on week days.
Initial download of the metrics may take a while.