Fig. 2
Download original image
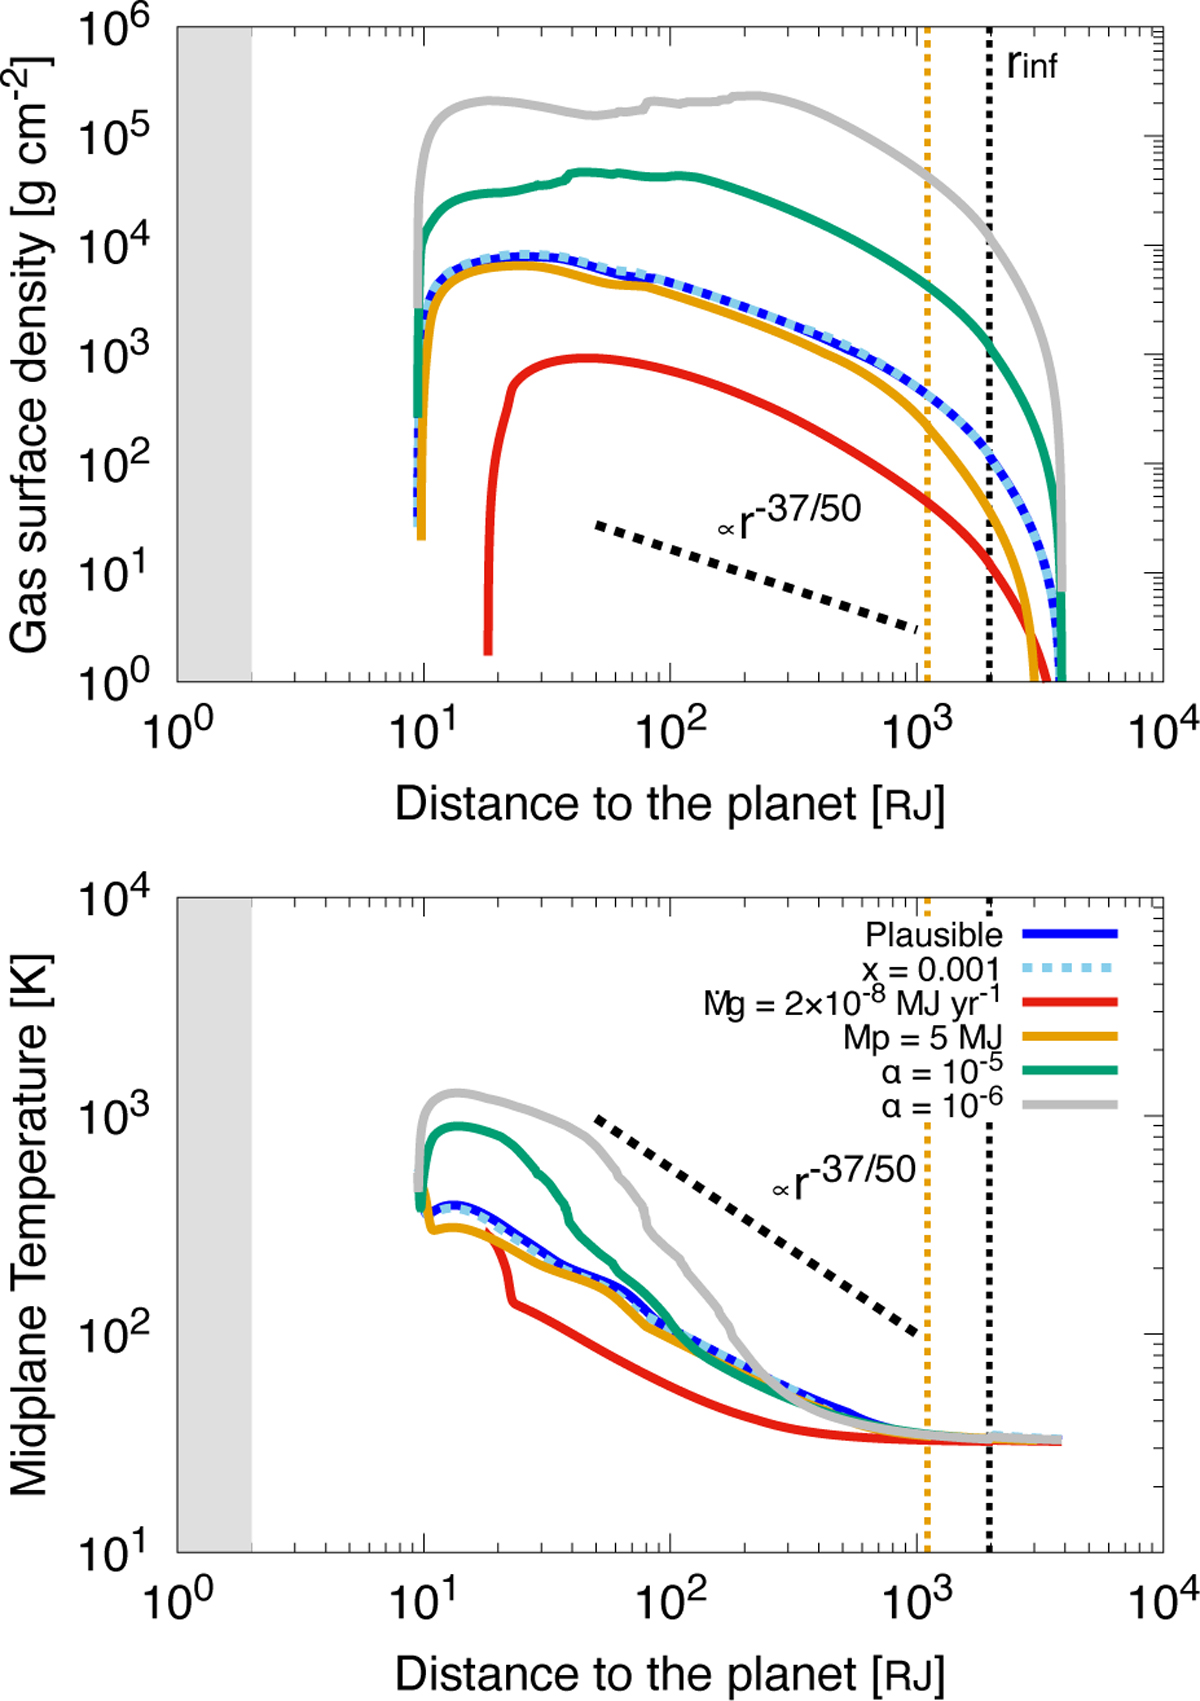
Gas surface density and disc midplane temperature of the CPD of PDS 70 c. The blue curves represent the plausible case: Mpl = 10 MJ, ![]() = 2 × 10⁻⁷ MJ yr−1, x = 0.01, and α = 10−4. The sky-blue, red, orange, green, and grey curves represent the cases with x = 0.001,
= 2 × 10⁻⁷ MJ yr−1, x = 0.01, and α = 10−4. The sky-blue, red, orange, green, and grey curves represent the cases with x = 0.001, ![]() = 2 × 10⁻⁸ MJ yr−1, Mpl = 5 MJ, α = 10−5, and α = 10−6, respectively. The vertical dotted lines are the outer edges of the gas inflow regions, r = rinf, which only depends on Mpl. The oblique dashed lines in the upper and lower panels represent the slopes of ∑g ∝ r−37/50 and T ∝ r−19/25, respectively. Shaded grey regions represent the planetary atmosphere.
= 2 × 10⁻⁸ MJ yr−1, Mpl = 5 MJ, α = 10−5, and α = 10−6, respectively. The vertical dotted lines are the outer edges of the gas inflow regions, r = rinf, which only depends on Mpl. The oblique dashed lines in the upper and lower panels represent the slopes of ∑g ∝ r−37/50 and T ∝ r−19/25, respectively. Shaded grey regions represent the planetary atmosphere.
Current usage metrics show cumulative count of Article Views (full-text article views including HTML views, PDF and ePub downloads, according to the available data) and Abstracts Views on Vision4Press platform.
Data correspond to usage on the plateform after 2015. The current usage metrics is available 48-96 hours after online publication and is updated daily on week days.
Initial download of the metrics may take a while.