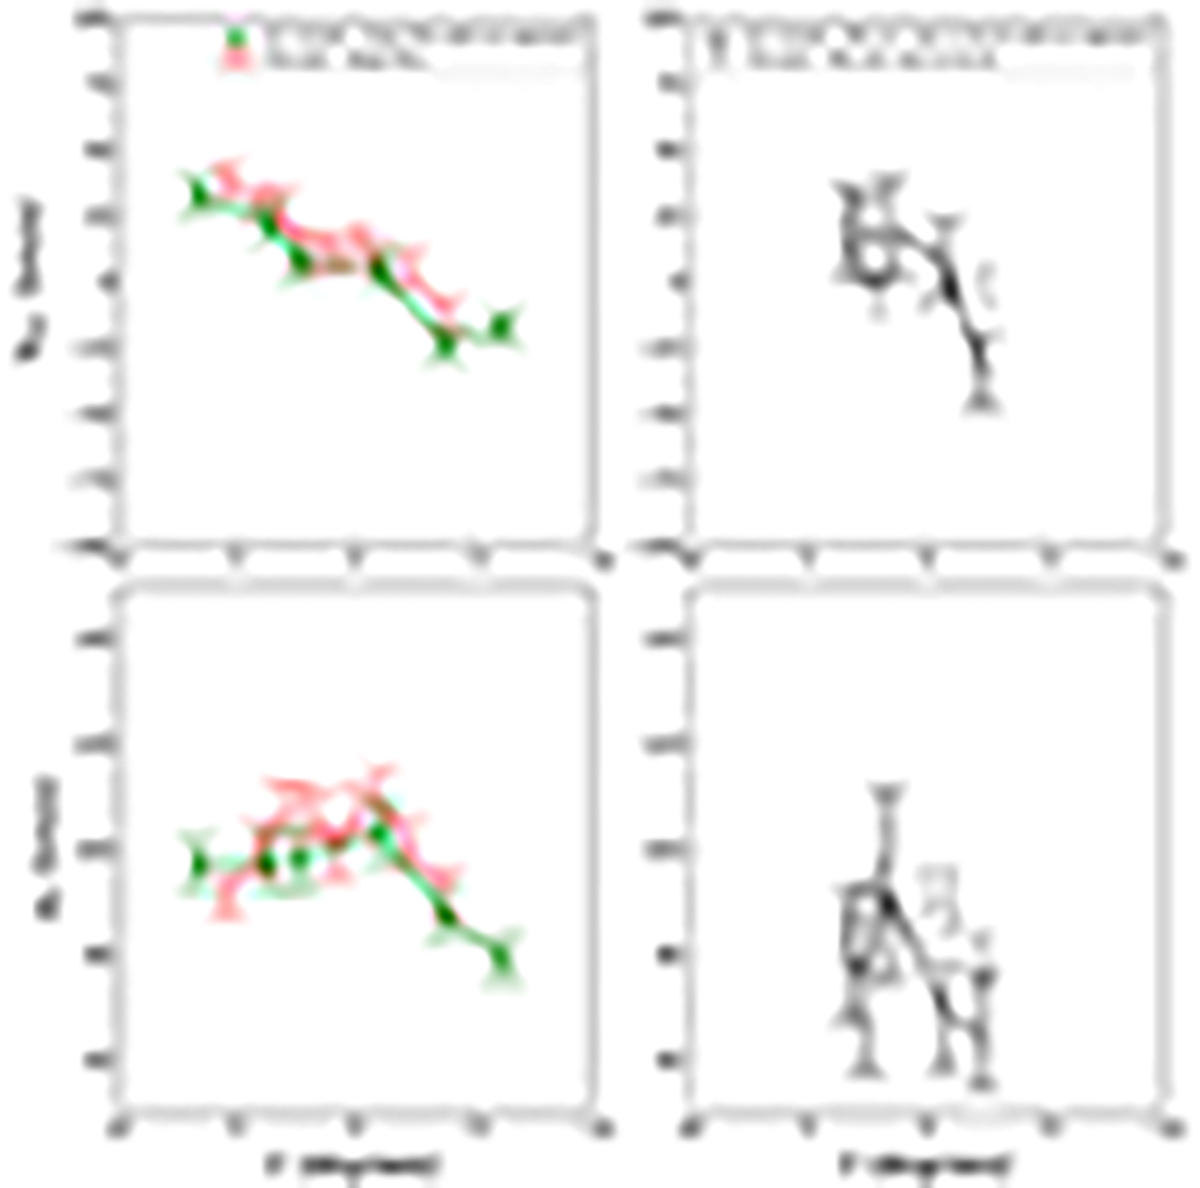
Fig. A.1.

Download original image
Kinematics of the bulge RRLs compared with the data of K22 using our approach. Top panels: Rotation curve of the bulge-confined RRLs of our sample separated by those farther away (dashed red line) and those more centrally concentrated (dashed grey line). The rotation curves from K22 using our orbital selection are also presented where with green crosses are the inner bulge and white circles for the central bulge RRLs. Bottom panels: The velocity dispersion curves using the same symbols. The velocity dispersion of the central bulge RRLs from K22 have larger errors because there are fewer stars per bin.
Current usage metrics show cumulative count of Article Views (full-text article views including HTML views, PDF and ePub downloads, according to the available data) and Abstracts Views on Vision4Press platform.
Data correspond to usage on the plateform after 2015. The current usage metrics is available 48-96 hours after online publication and is updated daily on week days.
Initial download of the metrics may take a while.


