Open Access
Fig. 9
Download original image
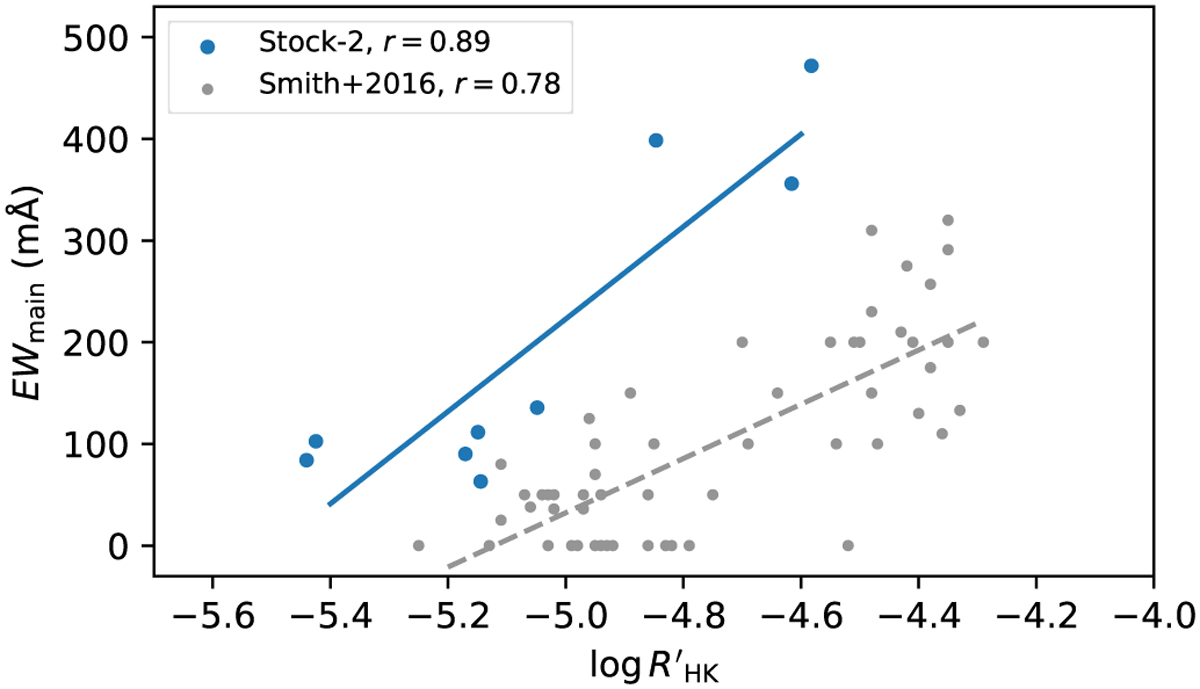
EW(He) of the main He 10 830 component versus ![]() for Stock 2 RC stars. For comparison, dwarf stars from Smith (2016) are plotted in grey. The r values indicate the Pearson correlation coefficients of the linear fitting for the RC and dwarf stars.
for Stock 2 RC stars. For comparison, dwarf stars from Smith (2016) are plotted in grey. The r values indicate the Pearson correlation coefficients of the linear fitting for the RC and dwarf stars.
Current usage metrics show cumulative count of Article Views (full-text article views including HTML views, PDF and ePub downloads, according to the available data) and Abstracts Views on Vision4Press platform.
Data correspond to usage on the plateform after 2015. The current usage metrics is available 48-96 hours after online publication and is updated daily on week days.
Initial download of the metrics may take a while.