Open Access
Fig. 5
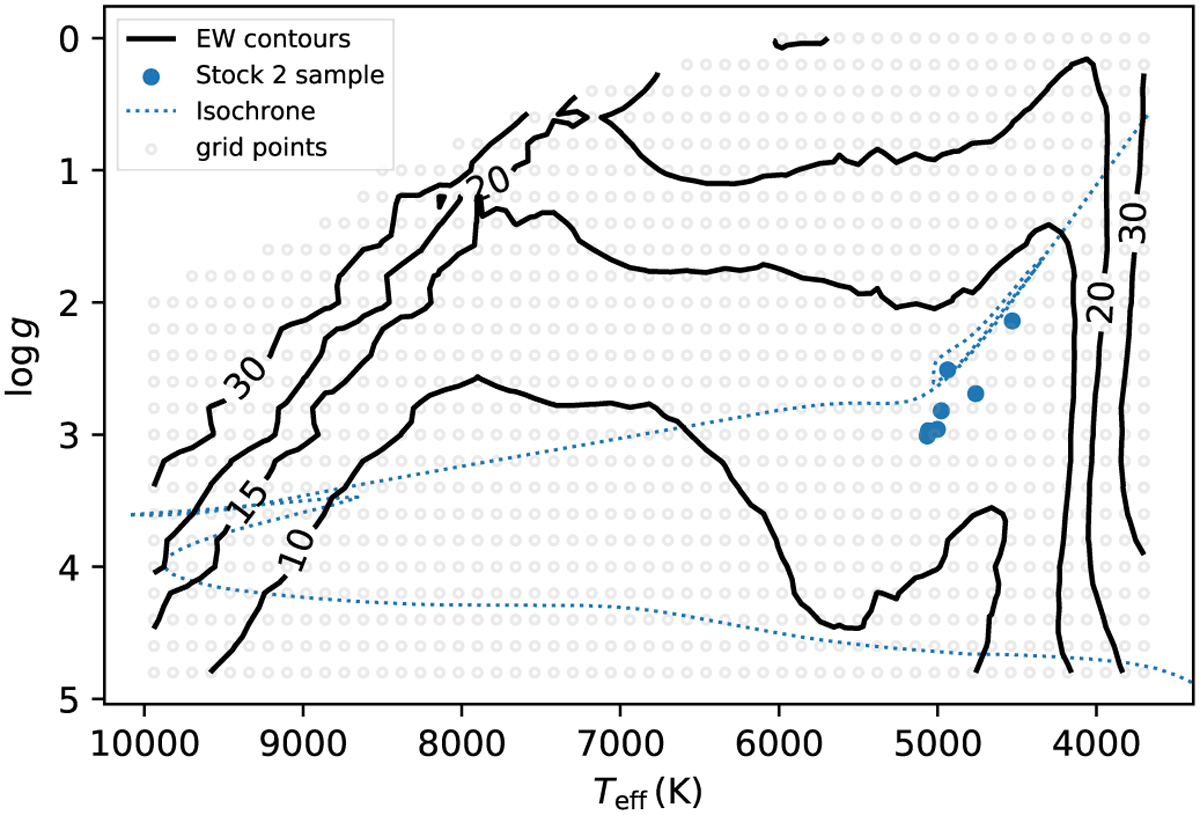
Download original image
EW contours (in mÅ) of blending lines across the Kiel diagram, i.e. Teff–log (𝑔), in solar metallicity and GIANO-B resolution (R = 50 000). The grey circles are the grid points used to calculate the contours, and the blue points indicate our Stock 2 sample. The isochrone used in Fig. 1 is plotted as a reference.
Current usage metrics show cumulative count of Article Views (full-text article views including HTML views, PDF and ePub downloads, according to the available data) and Abstracts Views on Vision4Press platform.
Data correspond to usage on the plateform after 2015. The current usage metrics is available 48-96 hours after online publication and is updated daily on week days.
Initial download of the metrics may take a while.