Fig. 3
Download original image
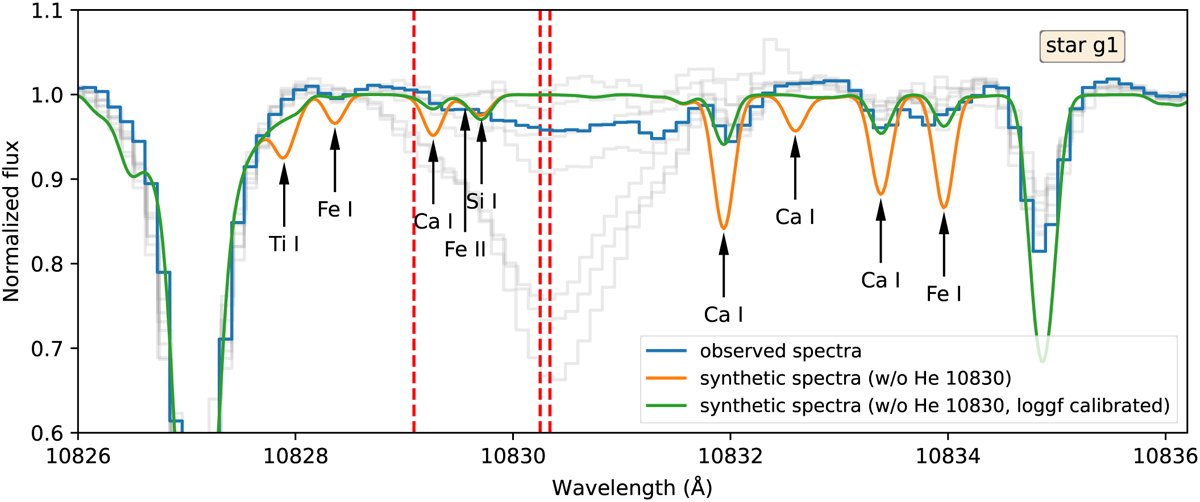
Observed (blue step line; with telluric correction) and the synthetic spectra before (orange) and after (green) their log 𝑔f values are calibrated (without the He 10 830) for star g1. Vertical dashed red lines indicate the position of the He 10 830 triplet, and the black arrows indicate the position of blending lines with log 𝑔f values calibrated (see Sect. 3). The spectra of the other eight target stars are plotted in grey as a reference.
Current usage metrics show cumulative count of Article Views (full-text article views including HTML views, PDF and ePub downloads, according to the available data) and Abstracts Views on Vision4Press platform.
Data correspond to usage on the plateform after 2015. The current usage metrics is available 48-96 hours after online publication and is updated daily on week days.
Initial download of the metrics may take a while.