Fig. 4
Download original image
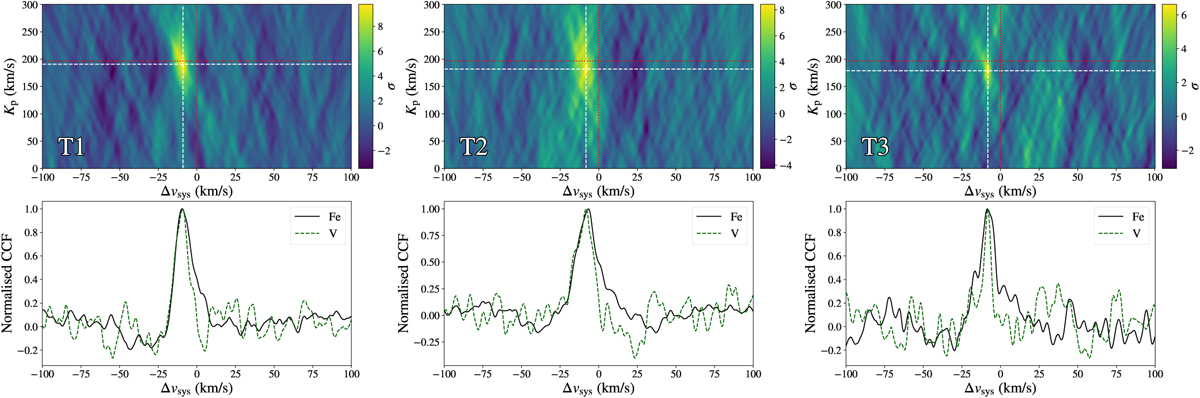
Kp – Δvsys maps of V for T1, T2, and T3. Upper: the V atmospheric models were calculated using the optimum parameters from our various atmospheric retrievals but are un-broadened. The dotted red lines show the expected planetary velocity values, whereas the dashed white lines show the maximum Kp and Δvsys values. Lower: comparison of the CCF of Fe and V, at their optimum Kp value. As the models were un-broadened, this distribution can be used as a proxy for the average line shape of each species in our data, highlighting any apparent asymmetries in the species’ longitudinal distributions.
Current usage metrics show cumulative count of Article Views (full-text article views including HTML views, PDF and ePub downloads, according to the available data) and Abstracts Views on Vision4Press platform.
Data correspond to usage on the plateform after 2015. The current usage metrics is available 48-96 hours after online publication and is updated daily on week days.
Initial download of the metrics may take a while.