Open Access
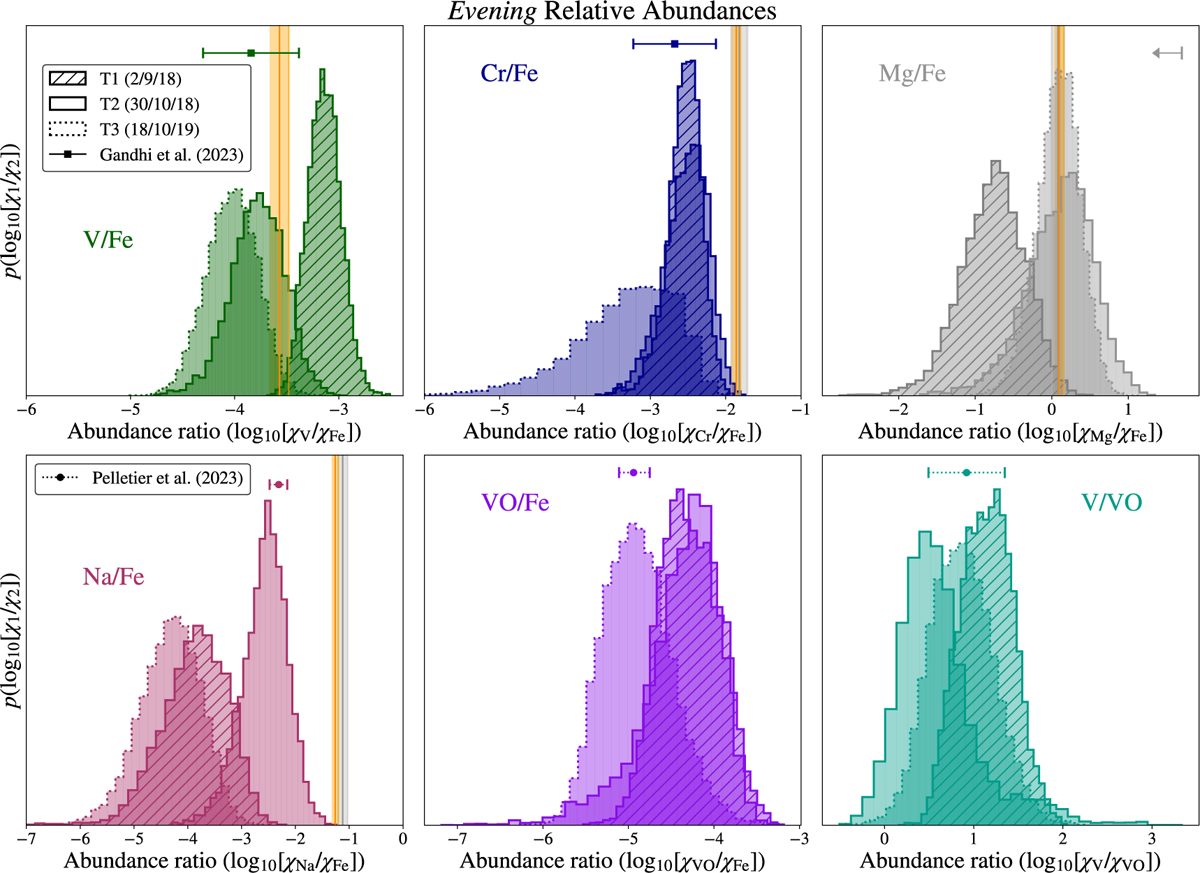
Fig. 3
Download original image
Relative abundance comparison across each of the three transits, for the evening limb. Shaded regions are as in Fig. 2. The weighted mean of the retrieved relative abundances in regions A and B (evening) from G2023 are also shown, where measured.
Current usage metrics show cumulative count of Article Views (full-text article views including HTML views, PDF and ePub downloads, according to the available data) and Abstracts Views on Vision4Press platform.
Data correspond to usage on the plateform after 2015. The current usage metrics is available 48-96 hours after online publication and is updated daily on week days.
Initial download of the metrics may take a while.