Fig. E.2
Download original image
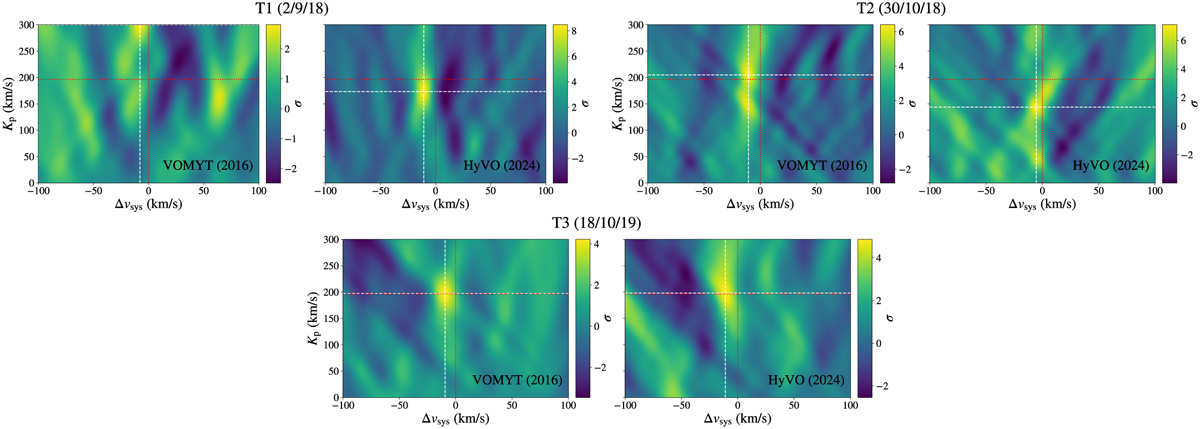
Kp – Δvsys maps of VO, for T1, T2, and T3, using both the VOMYT (McKemmish et al. 2016) and HyVO (Bowesman et al. 2024) line lists. The VO cross-sections were calculated at T = 2800 K and P = 0.1 mbar. The transmission spectra were computed using an isothermal T-P profile and convolved with a 1D Gaussian kernel. The dotted red lines show the expected planetary velocity values, whereas the dashed white lines show the maximum Kp and Δvsys values.
Current usage metrics show cumulative count of Article Views (full-text article views including HTML views, PDF and ePub downloads, according to the available data) and Abstracts Views on Vision4Press platform.
Data correspond to usage on the plateform after 2015. The current usage metrics is available 48-96 hours after online publication and is updated daily on week days.
Initial download of the metrics may take a while.