Fig. 3
Download original image
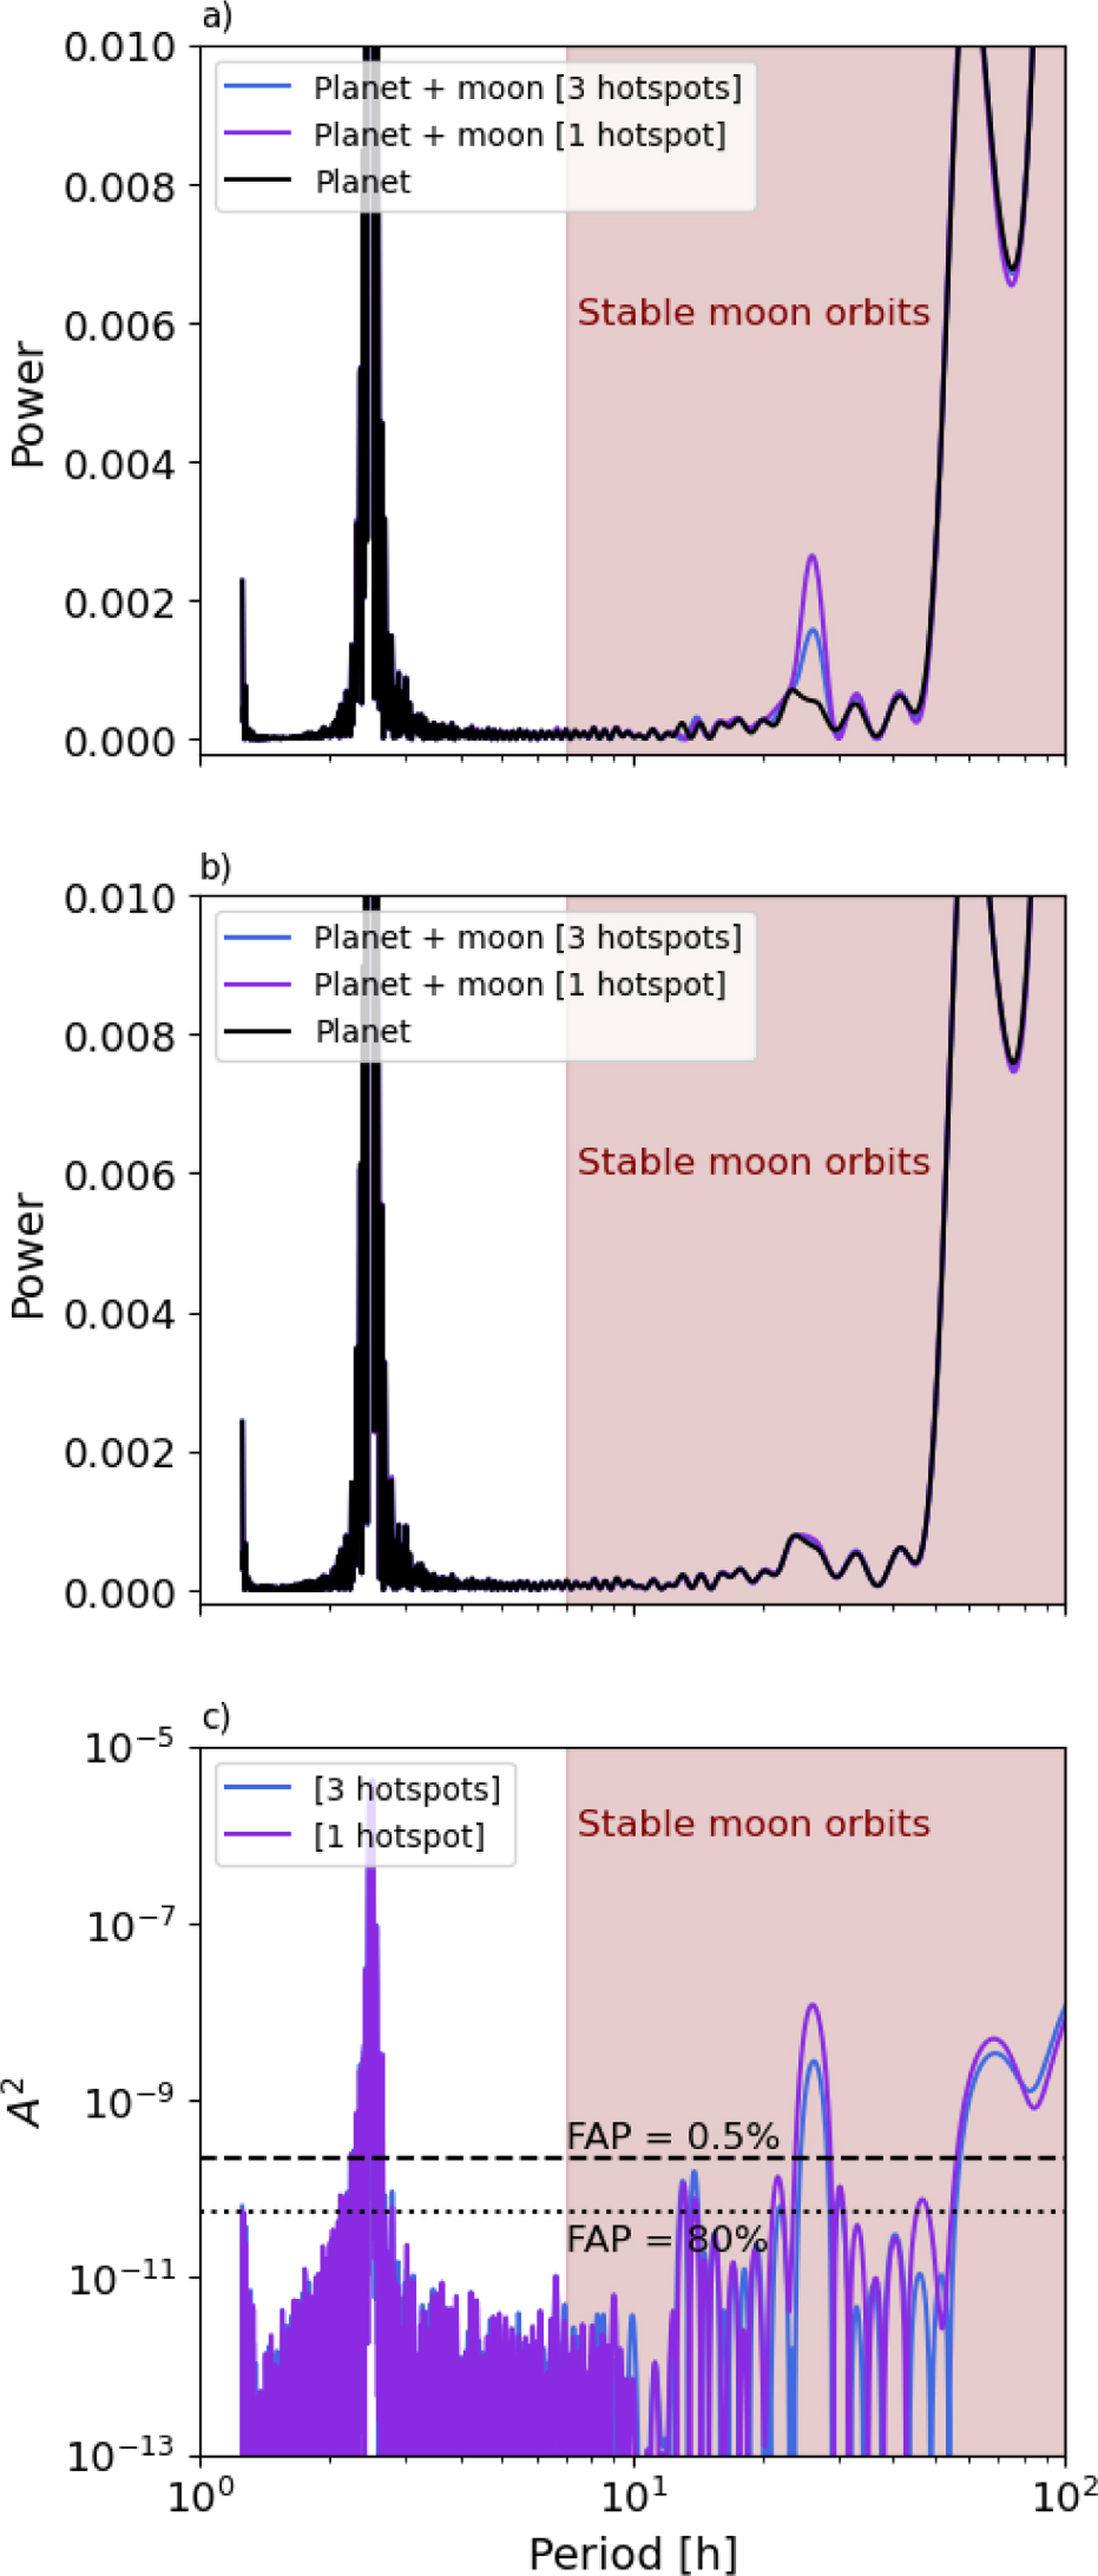
(a) Lomb–Scargle periodogram for MIRI filter F770W. (b) Lomb-Scargle periodogram for MIRI filter F1800W. The THEM signal is diluted in longer thermal wavelengths. (c) A2 as a function of the moon’s orbital period for the 2.5 h variable IPMO and an Earth-sized exomoon with Th = 1000 K at an edge-on orbit at 3 pc. The dashed and dotted black lines denote FAP = 0.5% and FAP = 80%. The red area shows the stable moon orbit region, between the host’s Roche limit and the Hill sphere.
Current usage metrics show cumulative count of Article Views (full-text article views including HTML views, PDF and ePub downloads, according to the available data) and Abstracts Views on Vision4Press platform.
Data correspond to usage on the plateform after 2015. The current usage metrics is available 48-96 hours after online publication and is updated daily on week days.
Initial download of the metrics may take a while.