Fig. 6
Download original image
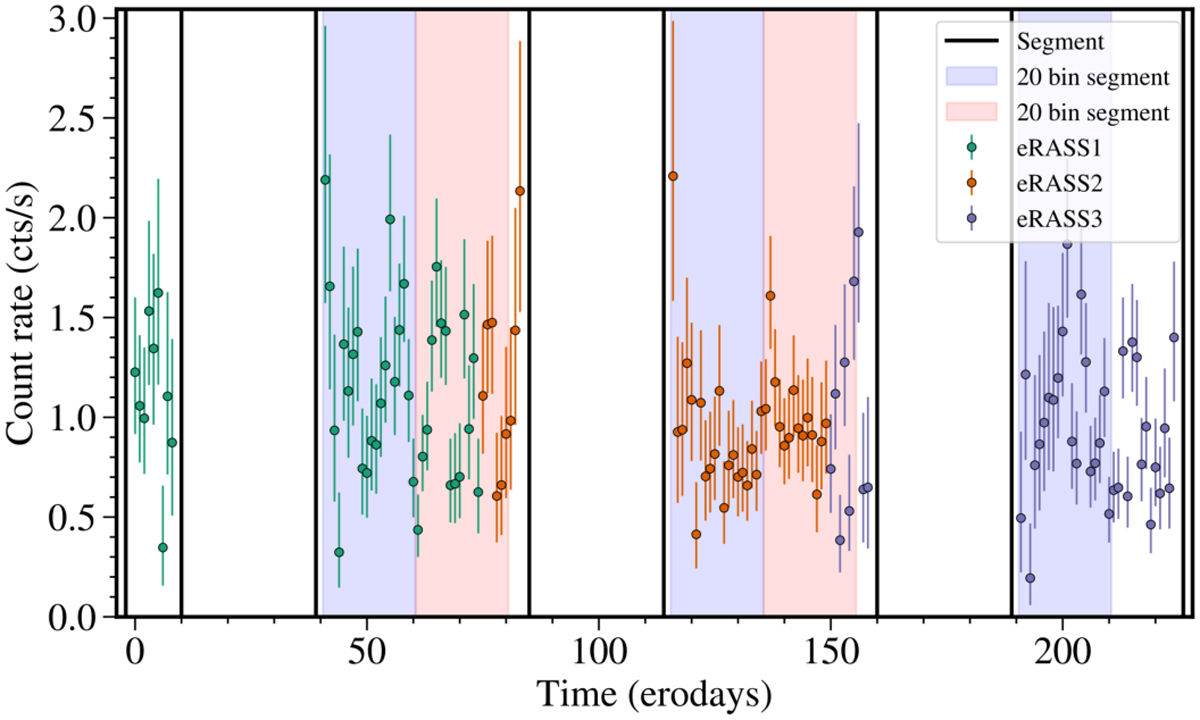
Simulated, and simplified eROSITA pink noise light curve, showing the definition of segments, 20 bin segments, and how these relate to eRASSs. For this example, we reduced the length of an eRASS to 75 erodays (rather than 1080), and simulated a bright variable source observed on 43 erodays per eRASS. Segments are identified by vertical black lines at their start and end. In light curves of actual data presented below we omitted the gaps between segments. Within the segments, we also identified sets of 20 bin segments, for a variability analysis of a fixed frequency range. These are indicated via blue and red regions in the figure. The colour of the data points corresponds to the eRASS the observation occurred in. Segments can contain data from different eRASSs.
Current usage metrics show cumulative count of Article Views (full-text article views including HTML views, PDF and ePub downloads, according to the available data) and Abstracts Views on Vision4Press platform.
Data correspond to usage on the plateform after 2015. The current usage metrics is available 48-96 hours after online publication and is updated daily on week days.
Initial download of the metrics may take a while.