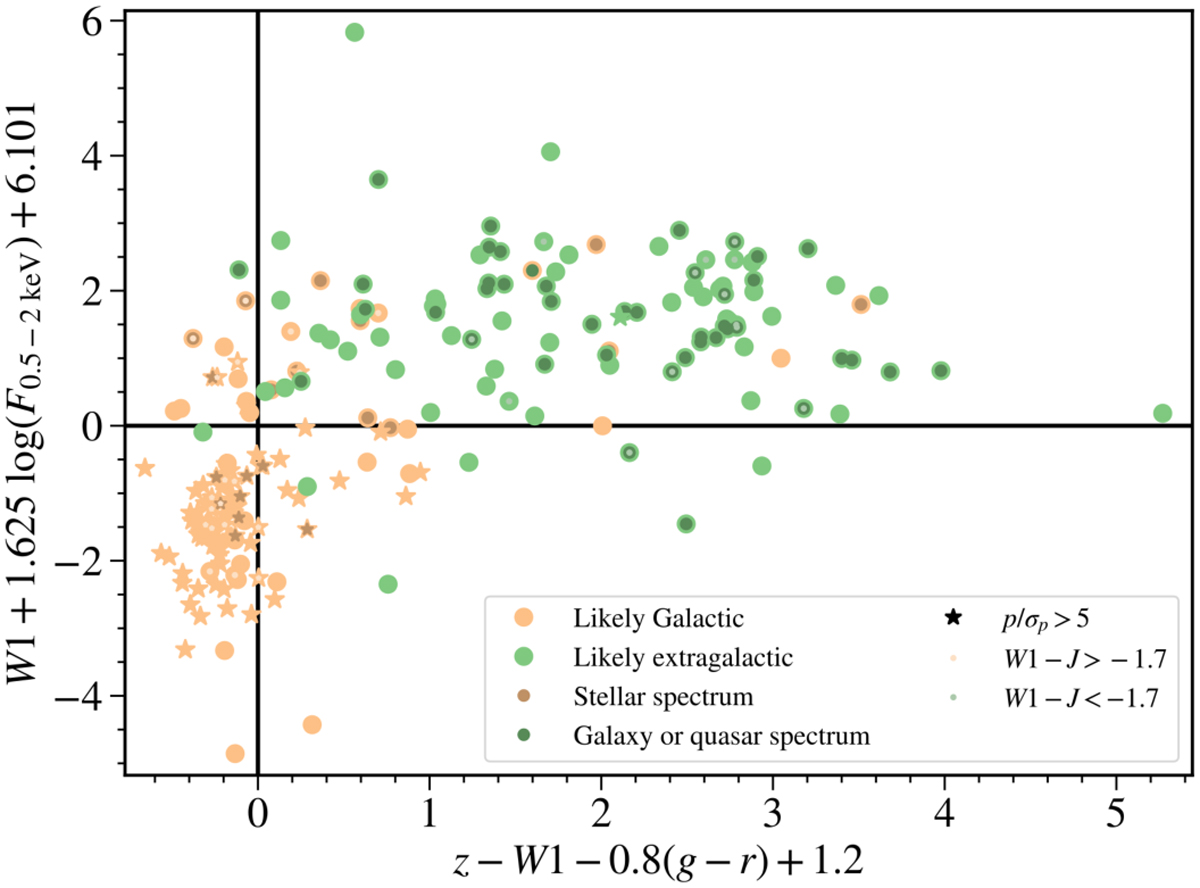
Fig. 5
Download original image
Classification of variable sources, according to the five methods outlined in Sect. 7.1, and the flowchart of Fig. 4. Sources that were not matched to an optical counterpart, or whose counterparts lacked information on the W1, g, r, or z magnitudes, are not shown. The largest circles indicate the final classification of sources. Smaller circles and stars indicate the results of different methods.
Current usage metrics show cumulative count of Article Views (full-text article views including HTML views, PDF and ePub downloads, according to the available data) and Abstracts Views on Vision4Press platform.
Data correspond to usage on the plateform after 2015. The current usage metrics is available 48-96 hours after online publication and is updated daily on week days.
Initial download of the metrics may take a while.