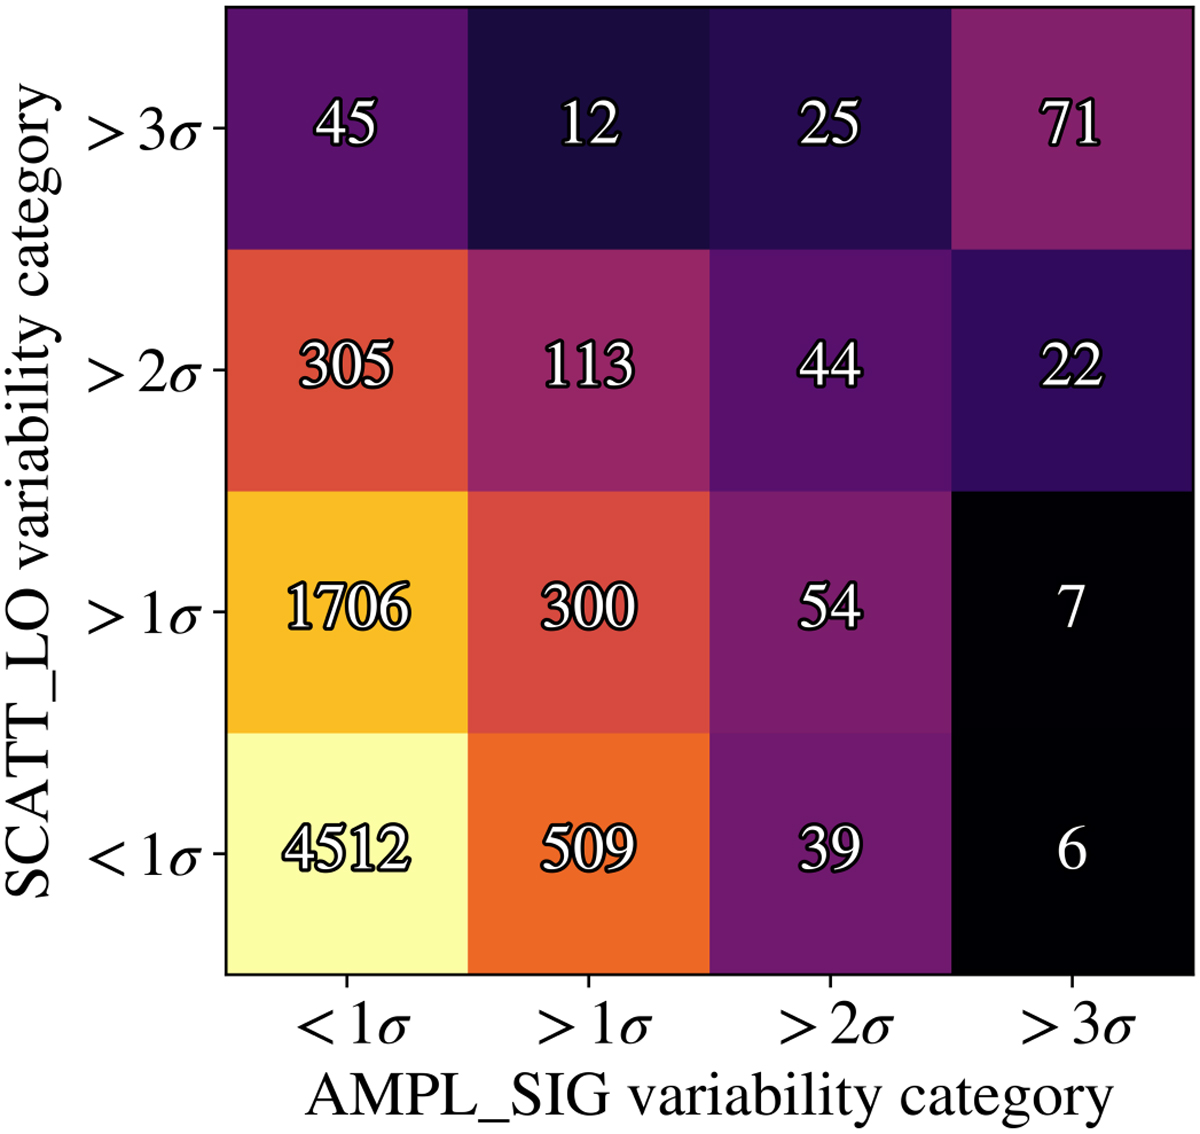
Fig. 3
Download original image
Number of sources identified in each of the four variability categories, for the two variability identifiers SCATT_LO and AMPL_SIG. We added the numbers of sources in each of the 16 categories from the three separate analyses of the three individual eRASSs. This means that many sources will appear up to three times in this figure, possibly in different regions. All four categories exclude sources at a higher variability significance. For example, sources that are shown to lie in the bin >1σ do not include the sources observed with a variability significance of >2σ.
Current usage metrics show cumulative count of Article Views (full-text article views including HTML views, PDF and ePub downloads, according to the available data) and Abstracts Views on Vision4Press platform.
Data correspond to usage on the plateform after 2015. The current usage metrics is available 48-96 hours after online publication and is updated daily on week days.
Initial download of the metrics may take a while.