Fig. A.5
Download original image
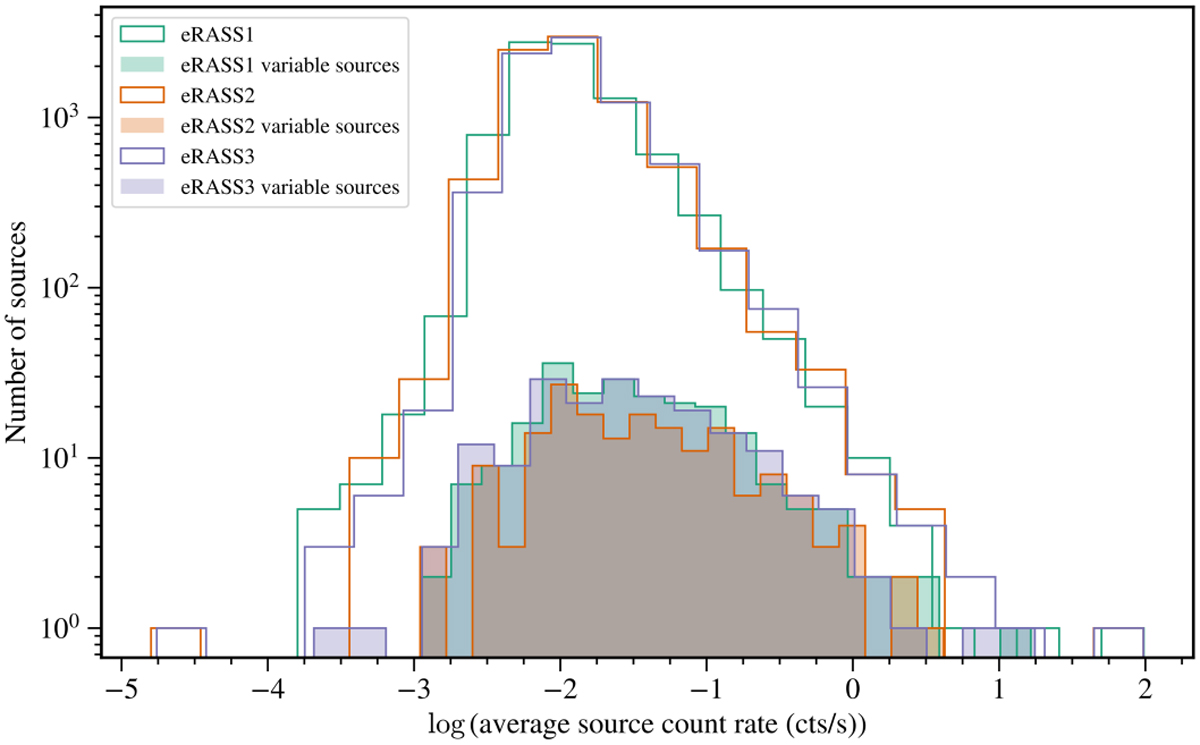
Distribution of the average count rates of sources in the SEP field, in eRASS1, 2, and 3. The average count rates were determined by Eq. A.3. Due to the high exposures in the SEP field, eROSITA could detect sources at much lower count rates than in the rest of the sky. This figure does not show the six sources with a slightly negative average count rate.
Current usage metrics show cumulative count of Article Views (full-text article views including HTML views, PDF and ePub downloads, according to the available data) and Abstracts Views on Vision4Press platform.
Data correspond to usage on the plateform after 2015. The current usage metrics is available 48-96 hours after online publication and is updated daily on week days.
Initial download of the metrics may take a while.