Fig. A.4
Download original image
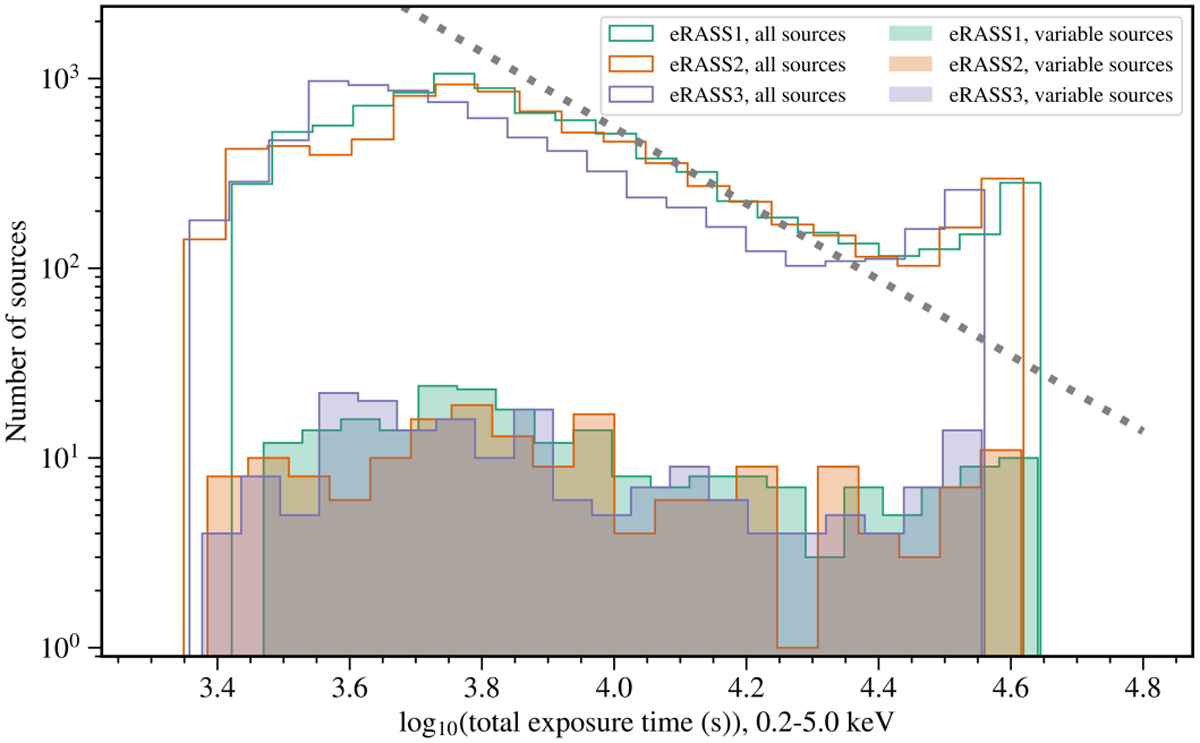
Distribution of the exposure time of sources in the SEP field, for eRASS1, 2, and 3. This quantity describes the total time that a source was inside the field of view, and does not consider vignetting effects. The distribution of the total exposure time for the sources we identify as variables is also shown. The grey dotted line depicts an inverse square relationship, showing that the drop in the number of sources within a logarithmic interval on the total exposure time is dominated by the decrease in the solid angle at a decreasing angle from the SEP.
Current usage metrics show cumulative count of Article Views (full-text article views including HTML views, PDF and ePub downloads, according to the available data) and Abstracts Views on Vision4Press platform.
Data correspond to usage on the plateform after 2015. The current usage metrics is available 48-96 hours after online publication and is updated daily on week days.
Initial download of the metrics may take a while.