Fig. A.1
Download original image
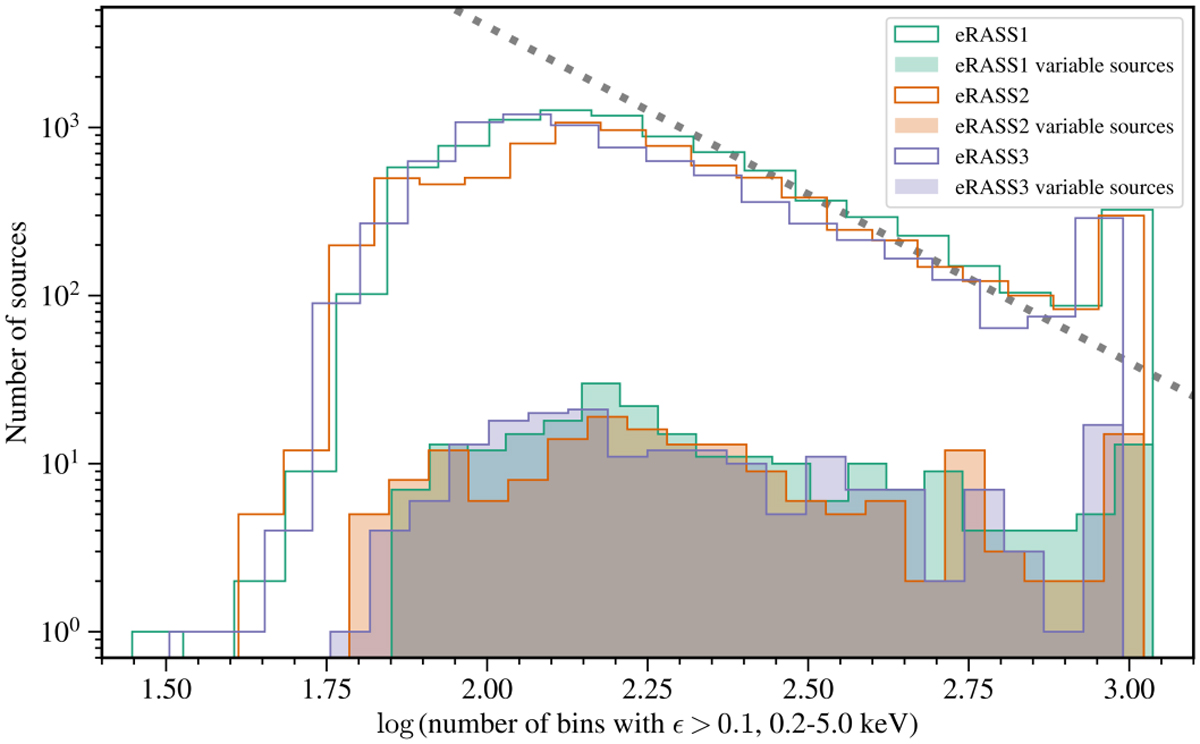
Histogram showing the distribution of the number of erodays that all sources in the SEP field were observed for, in eRASS1, 2, and 3. The coloured in histogram depicts the distribution of the number of erodays of observation of variable sources. The grey dotted line depicts an inverse square relationship, which approximately matches the decrease in the number of sources observed at a particular logarithmic interval on the number of bins. We only counted bins with a fractional exposure larger than 0.1.
Current usage metrics show cumulative count of Article Views (full-text article views including HTML views, PDF and ePub downloads, according to the available data) and Abstracts Views on Vision4Press platform.
Data correspond to usage on the plateform after 2015. The current usage metrics is available 48-96 hours after online publication and is updated daily on week days.
Initial download of the metrics may take a while.