Open Access
Fig. 2
Download original image
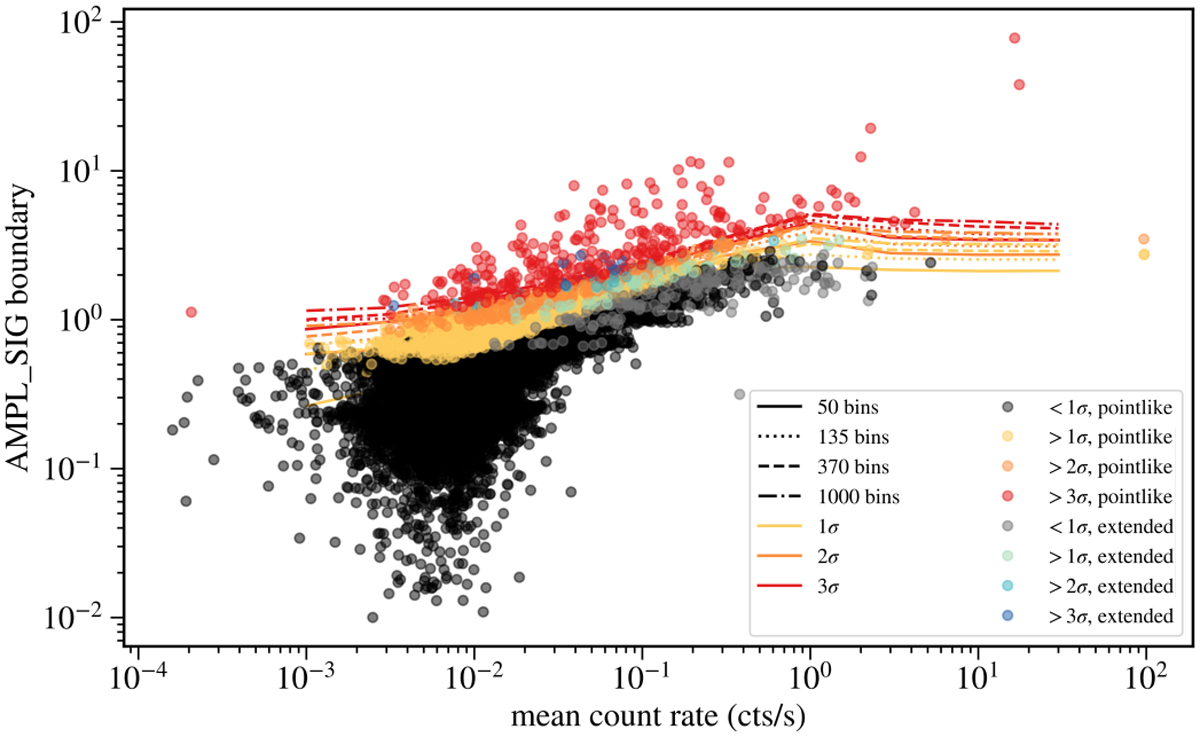
Distribution of AMPL_SIG of all sources detected in eRASS1, 2, and 3. The colours denote the variability class we assigned each source, based on the thresholds of AMPL_SIG. This figure also distinguishes between point-like and extended sources.
Current usage metrics show cumulative count of Article Views (full-text article views including HTML views, PDF and ePub downloads, according to the available data) and Abstracts Views on Vision4Press platform.
Data correspond to usage on the plateform after 2015. The current usage metrics is available 48-96 hours after online publication and is updated daily on week days.
Initial download of the metrics may take a while.