Fig. 10
Download original image
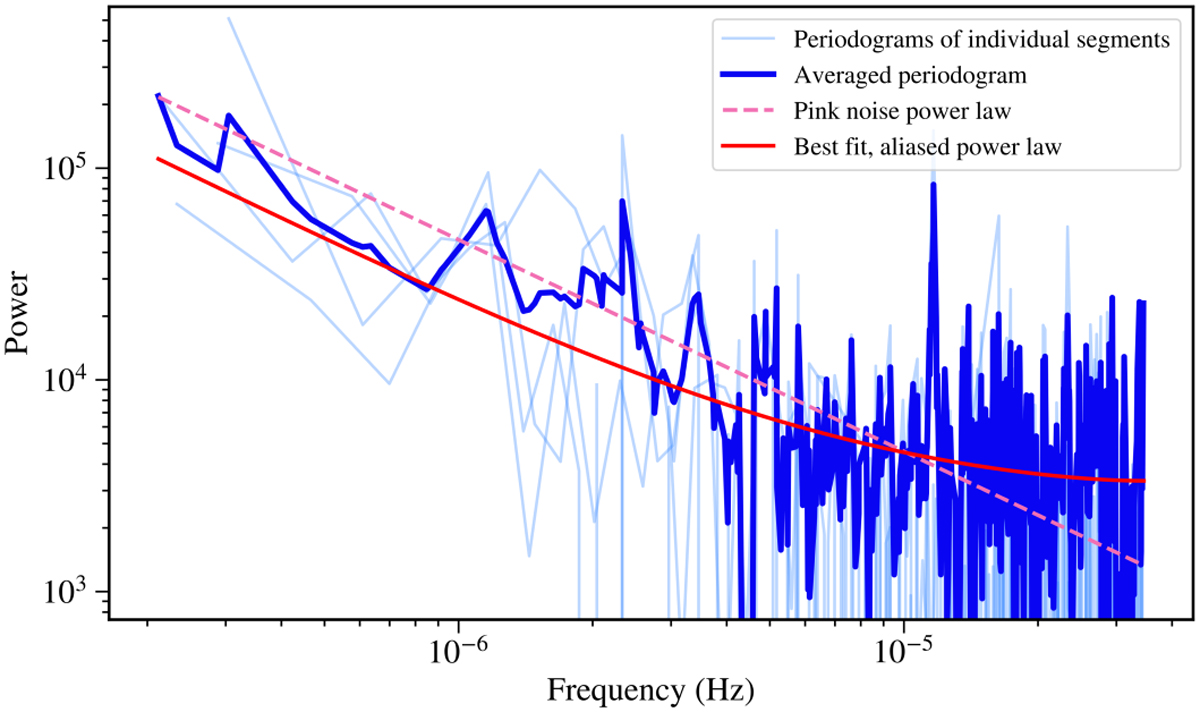
Periodograms of the likely extragalactic source eRASSt J055033.4-663653, whose light curve is shown in Fig. 9. The periodograms of individual segments of the light curve are shown in light blue. The averaged periodogram is displayed in dark blue. The red line denotes the best fit to all the periodograms of segments of the light curve, using an aliased single power law with α = 1.093 ± 0.050. The figure also features a dashed pink line that depicts a pink noise trend.
Current usage metrics show cumulative count of Article Views (full-text article views including HTML views, PDF and ePub downloads, according to the available data) and Abstracts Views on Vision4Press platform.
Data correspond to usage on the plateform after 2015. The current usage metrics is available 48-96 hours after online publication and is updated daily on week days.
Initial download of the metrics may take a while.