Fig. 8
Download original image
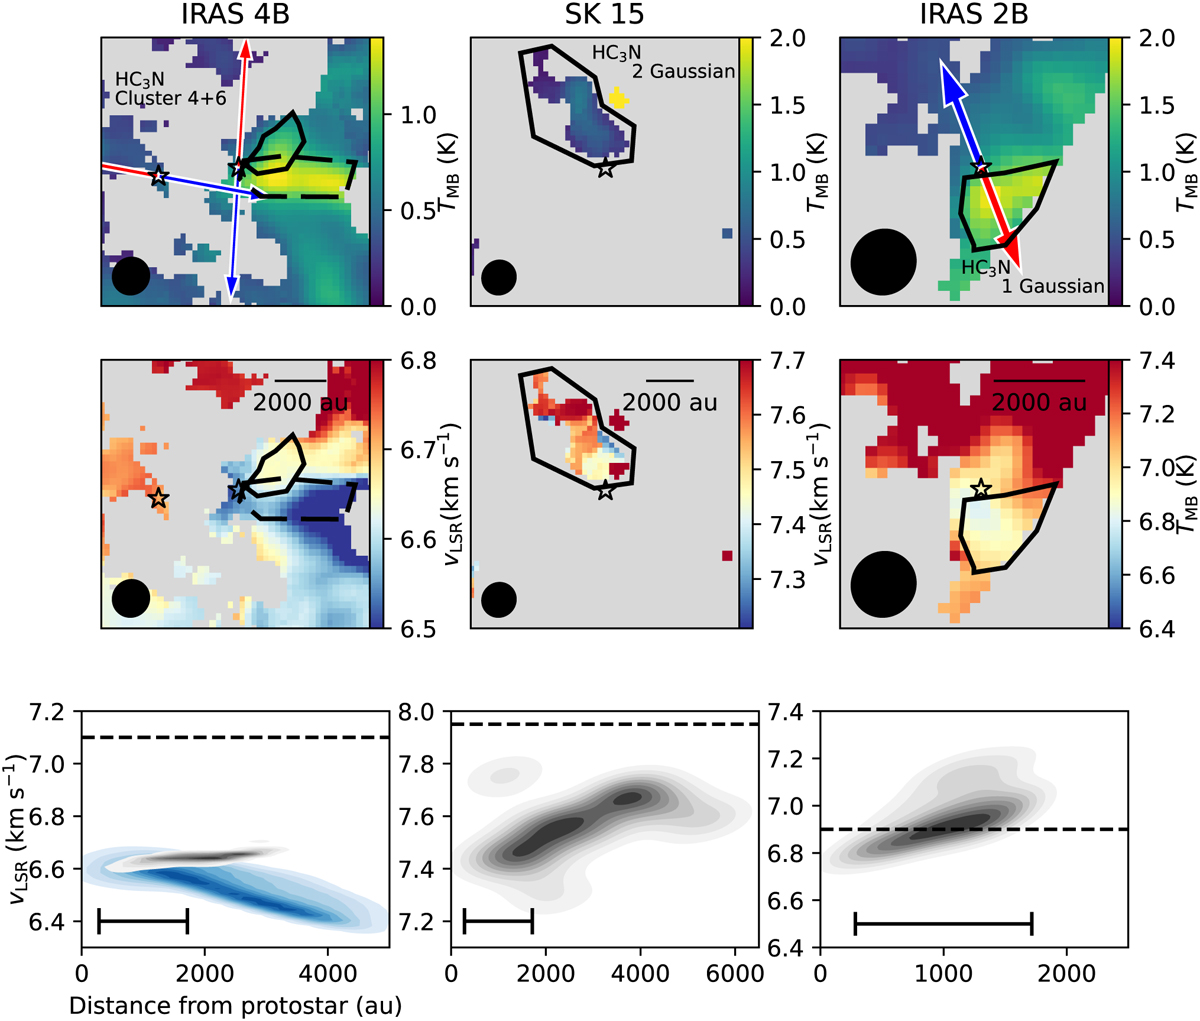
Zoom-in plots of HC3N emission for IRAS 4B (left), SK 15 (center), and IRAS 2B (right), with the same panels as shown in Fig. 7 left. The Gaussian component for each protostar is labeled accordingly. The black polygon marks the region selected as a potential streamer. The black ellipse in the bottom left corner represents the beam. For IRAS 4B, the black dashed polygon represents the region analyzed in relation to IRAS 4B2. Top: amplitude TMB of the Gaussian component. The blue and red arrows indicate the direction of the blue- and redshifted outflow lobes, respectively, for known outflows in the plotted area. Middle: central velocity υLSR of the Gaussian component. The scale bar represents a length of 2000 au. Bottom: KDE of the υLSR within the selected region. The black density histograms represent the KDE of the velocities within the black polygons. The dashed lines mark the υLSR of each protostar. The black scale bar represents a length equivalent to one beam. For IRAS 4B, the blue KDE represents the velocities within the dashed polygon.
Current usage metrics show cumulative count of Article Views (full-text article views including HTML views, PDF and ePub downloads, according to the available data) and Abstracts Views on Vision4Press platform.
Data correspond to usage on the plateform after 2015. The current usage metrics is available 48-96 hours after online publication and is updated daily on week days.
Initial download of the metrics may take a while.