Fig. 7
Download original image
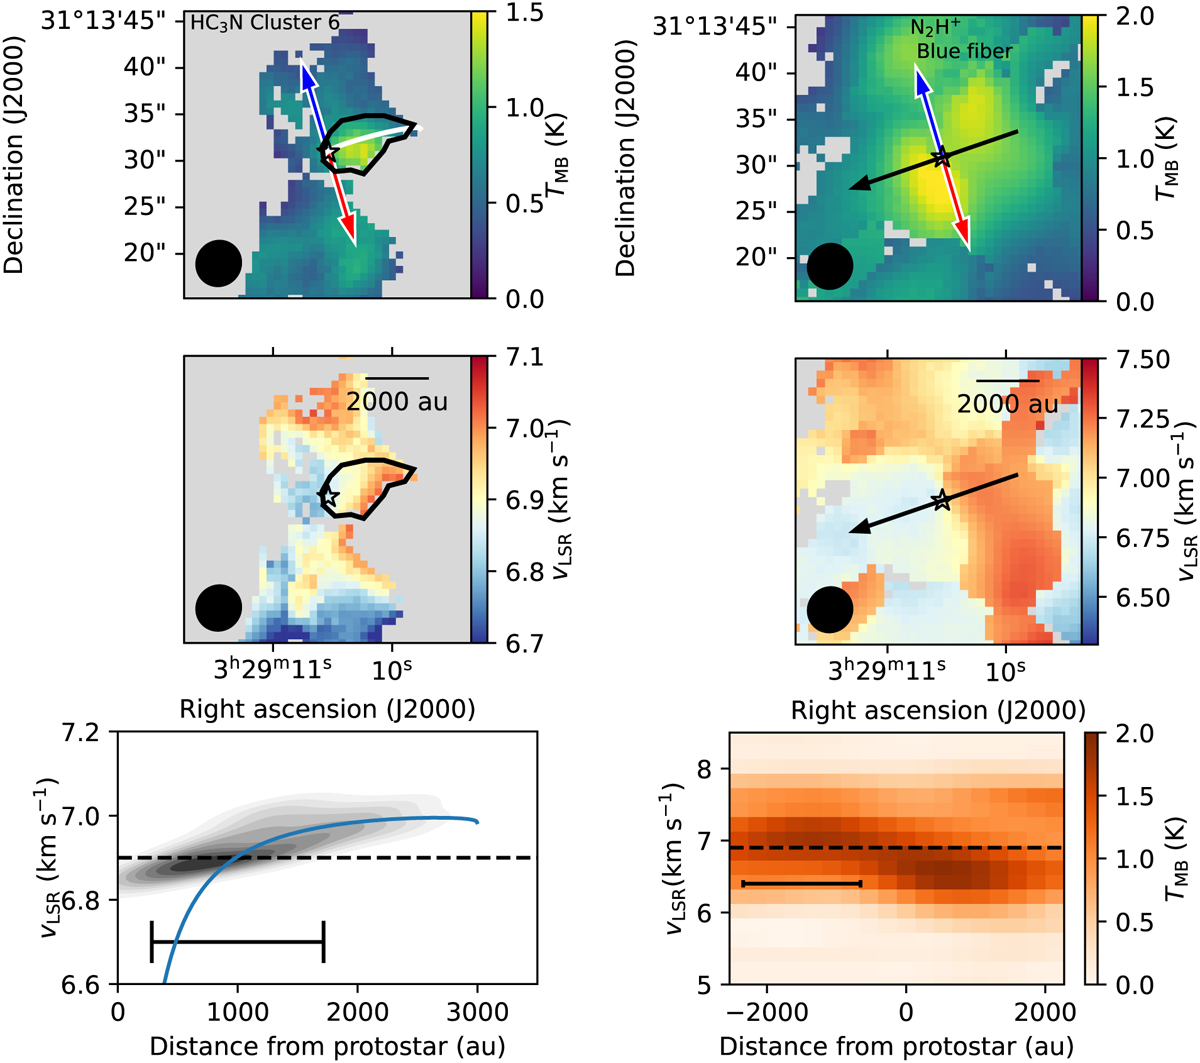
Zoom-in plots of the HC3N (left) and N2H+ (right) emission for IRAS 4A, together with the best free-fall trajectory found for the TMB and υLSR maps. Top: amplitude TMB of the Gaussian components corresponding to HC3N cluster 6 and to the blue N2H+ cluster. The black polygon marks the region selected as a potential streamer. The white curve marks the potential streamer trajectory. The blue and red arrows indicate the direction of the outflow lobes for IRAS 4A and 4B, and the black arrow on the N2H+ map shows the orientation of the position-velocity diagram at the bottom. Middle: central velocities vLSR of the Gaussian component. A scale bar representing 2000 au is shown in the top right corner of the image. Bottom left: KDE of the υLSR within the selected region. The black line at the bottom of the plot represents a length of one beam. The blue curve marks the velocity vs. the distance for the found free-fall solution. The dashed black line represents the protostar υLSR. Bottom right: N2H+ position–velocity diagram along the path indicated in the top panel. The dashed horizontal line marks the υLSR of the source (6.9 km s−1, Stephens et al. 2019). The black scale bar represents a length equivalent to one beam.
Current usage metrics show cumulative count of Article Views (full-text article views including HTML views, PDF and ePub downloads, according to the available data) and Abstracts Views on Vision4Press platform.
Data correspond to usage on the plateform after 2015. The current usage metrics is available 48-96 hours after online publication and is updated daily on week days.
Initial download of the metrics may take a while.