Fig. 6
Download original image
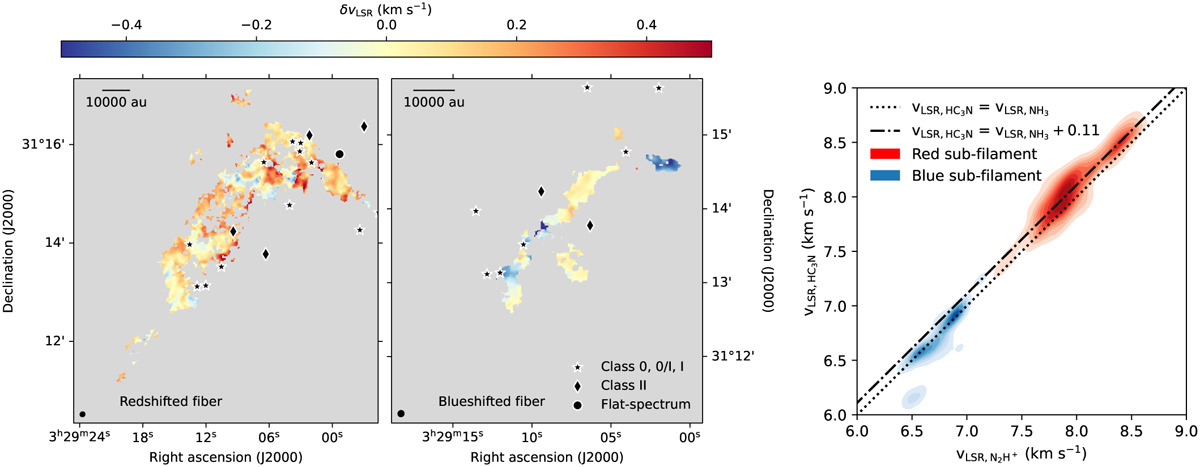
Difference between the velocity components of each fiber in NGC 1333 SE, as recognized after the clustering. Left: resulting difference after subtracting the N2H+ υLSR from the HC3N υLSR of the clusters belonging to the redshifted fiber. Middle: resulting difference after subtracting the N2H+ υLSR from the HC3N υLSR of the clusters belonging to the blueshifted fiber. The blueshifted fiber map is zoomed into the region covered by the emission. Right: 2D KDE of the HC3N υLSR vs. N2H+ υLSR. The dotted line represents the location where the velocities are equal, and the dash-dotted line shows where the HC3N υLSR is higher by 0.11 km s−1 (the median difference for the redshifted fiber).
Current usage metrics show cumulative count of Article Views (full-text article views including HTML views, PDF and ePub downloads, according to the available data) and Abstracts Views on Vision4Press platform.
Data correspond to usage on the plateform after 2015. The current usage metrics is available 48-96 hours after online publication and is updated daily on week days.
Initial download of the metrics may take a while.