Fig. 5
Download original image
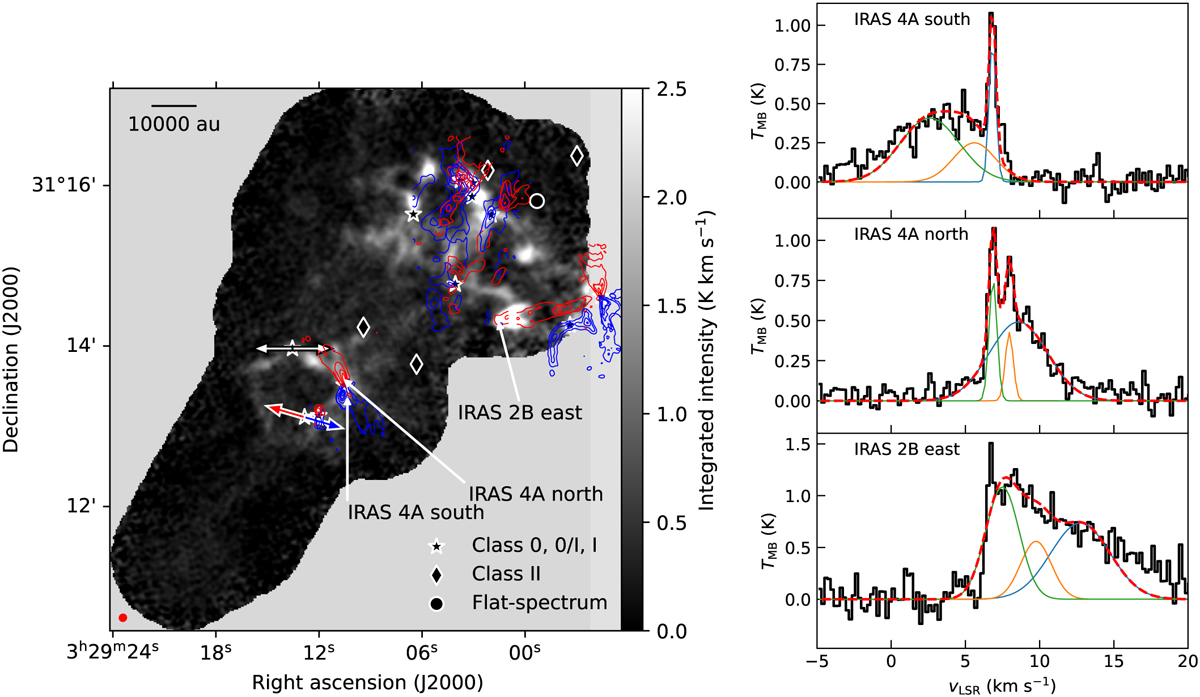
Correlation between the HC3N emission and outflows. Left: integrated-intensity map of HC3N J = 10 − 9 between 5 and 10 km s−1. The red symbols represent protostellar objects in the region, as in Fig. 1. The red and blue contours correspond to the 12CO red and blue outflow lobes, respectively, obtained from the MASSES survey (Stephens et al. 2019). The labels indicate from where each of the spectra is taken. Right: HC3N J = 10–9 spectra at the locations of the IRAS 4A outflow and at the bright emission east of IRAS 2B. For each location, we take the spectrum at an individual pixel. The blue, green, and red curves represent the individual three Gaussians fit at each position, and the dashed red curve represents the sum of all the Gaussians.
Current usage metrics show cumulative count of Article Views (full-text article views including HTML views, PDF and ePub downloads, according to the available data) and Abstracts Views on Vision4Press platform.
Data correspond to usage on the plateform after 2015. The current usage metrics is available 48-96 hours after online publication and is updated daily on week days.
Initial download of the metrics may take a while.