Fig. 3
Download original image
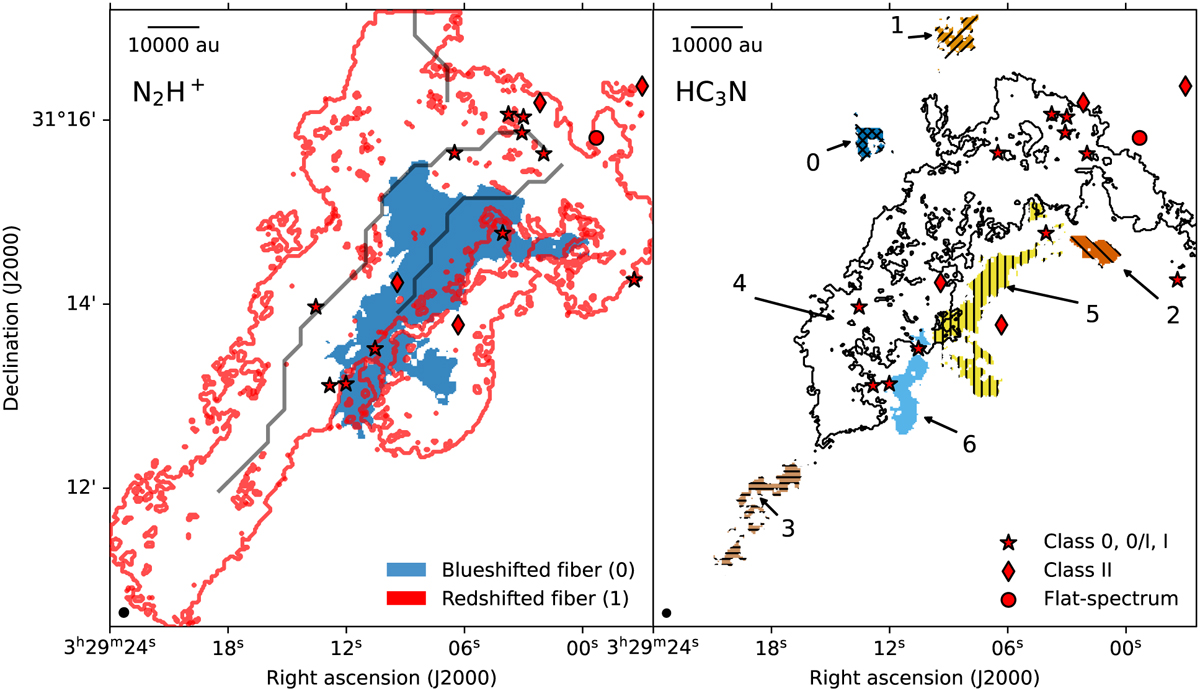
Results of the clustering algorithms for the Gaussian components of N2H+ and HC3N. The black circles in the bottom left corners represent the beam size of the respective data. The scale bar in the top left corner represents a length of 10 000 au. The semitransparent black lines show the spines of the fibers in NH3 (Chen et al. 2020b). Left: cluster groups for N2H+, labeled in red and blue and representing the more redshifted and blueshifted groups, respectively. Right: cluster groups for HC3N, labeled 0 to 6.
Current usage metrics show cumulative count of Article Views (full-text article views including HTML views, PDF and ePub downloads, according to the available data) and Abstracts Views on Vision4Press platform.
Data correspond to usage on the plateform after 2015. The current usage metrics is available 48-96 hours after online publication and is updated daily on week days.
Initial download of the metrics may take a while.