Open Access
Fig. B.1
Download original image
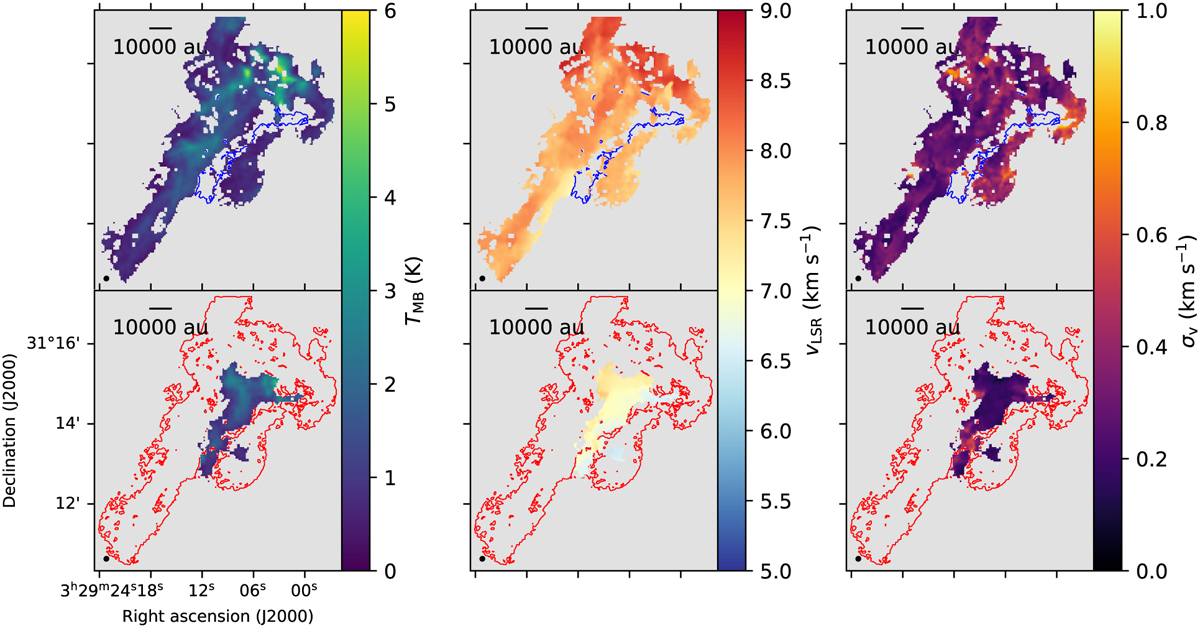
Peak temperature, central velocity, and velocity dispersion of the N2H+ clusters. Top: Tpeak, υLSR, and σv for the redshifted fiber. The blue contour indicates the position of the blueshifted fiber. Bottom: Tpeak, υLSR, and σv for the blueshifted fiber. The red contour indicates the position of the redshifted fiber.
Current usage metrics show cumulative count of Article Views (full-text article views including HTML views, PDF and ePub downloads, according to the available data) and Abstracts Views on Vision4Press platform.
Data correspond to usage on the plateform after 2015. The current usage metrics is available 48-96 hours after online publication and is updated daily on week days.
Initial download of the metrics may take a while.