Fig. 1
Download original image
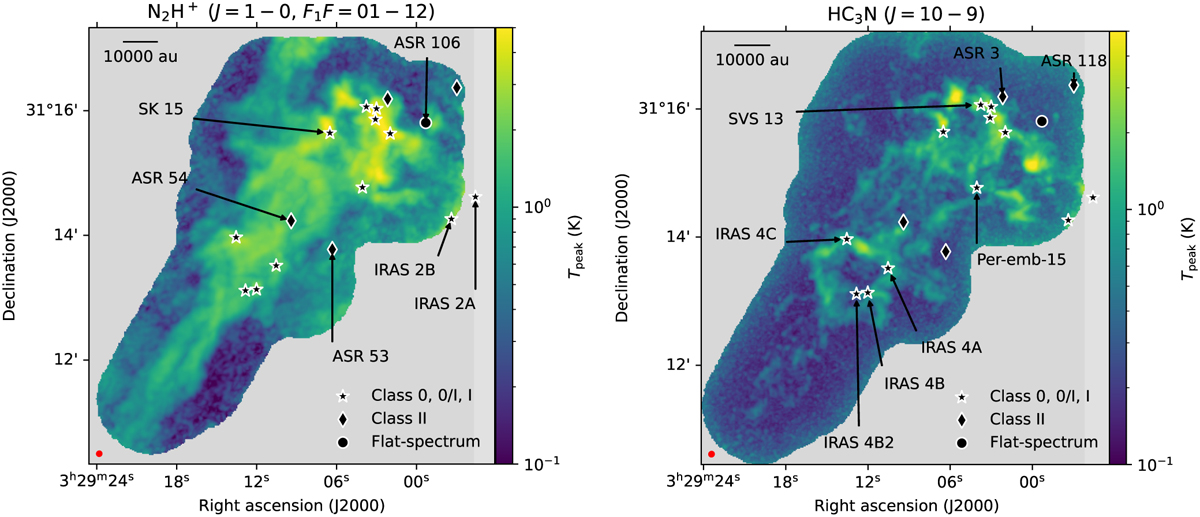
Peak temperature Tpeak maps of the NOEMA and 30m telescope observations. The black symbols represent YSOs in the region, summarized in Table 2: stars mark the positions of Class 0, I, and 0/I protostars, circles represent flat-spectrum objects, and diamonds mark Class II sources. The protostars are labeled following Table 2. Left: N2H+ J = 1 − 0, F1F = 01 − 12 Tpeak. Right: HC3N J = 10 − 9 Tpeak.
Current usage metrics show cumulative count of Article Views (full-text article views including HTML views, PDF and ePub downloads, according to the available data) and Abstracts Views on Vision4Press platform.
Data correspond to usage on the plateform after 2015. The current usage metrics is available 48-96 hours after online publication and is updated daily on week days.
Initial download of the metrics may take a while.