Fig. A.1
Download original image
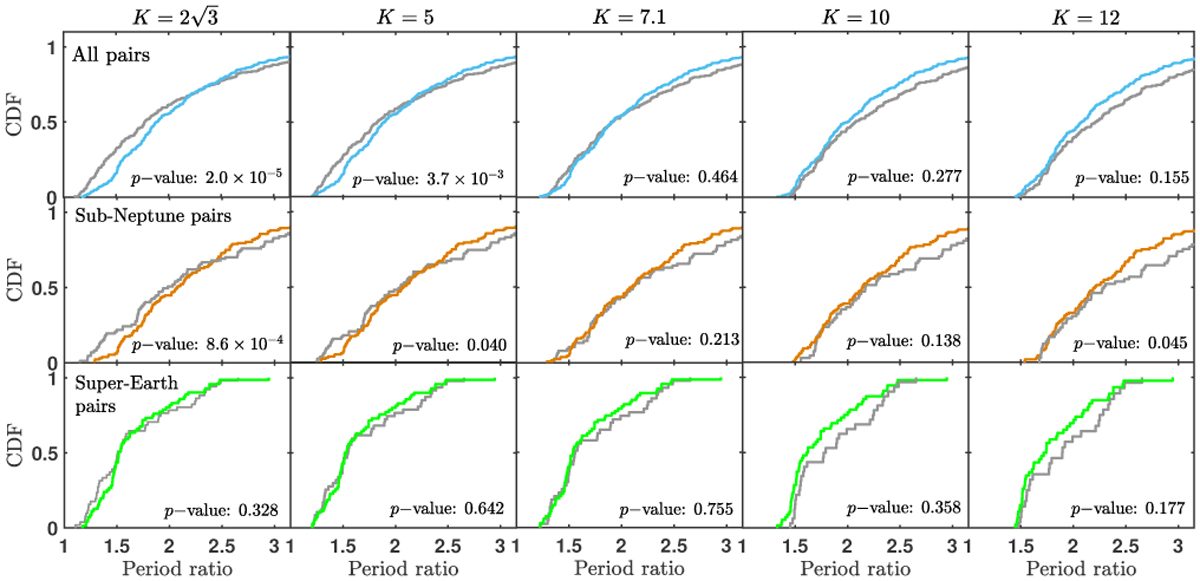
Cumulative distributions for all the adjacent planet pairs (top, cyan), sub-Neptune pairs (middle, orange), and super-Earth pairs (bottom, green) selected as Hill stability with different lower limits of orbital spacing in the observed sample. The distributions of the corresponding randomly paired control samples are plotted in grey. We also show all the KS p-values of the observed planet pairs compared to those in the control sample.
Current usage metrics show cumulative count of Article Views (full-text article views including HTML views, PDF and ePub downloads, according to the available data) and Abstracts Views on Vision4Press platform.
Data correspond to usage on the plateform after 2015. The current usage metrics is available 48-96 hours after online publication and is updated daily on week days.
Initial download of the metrics may take a while.