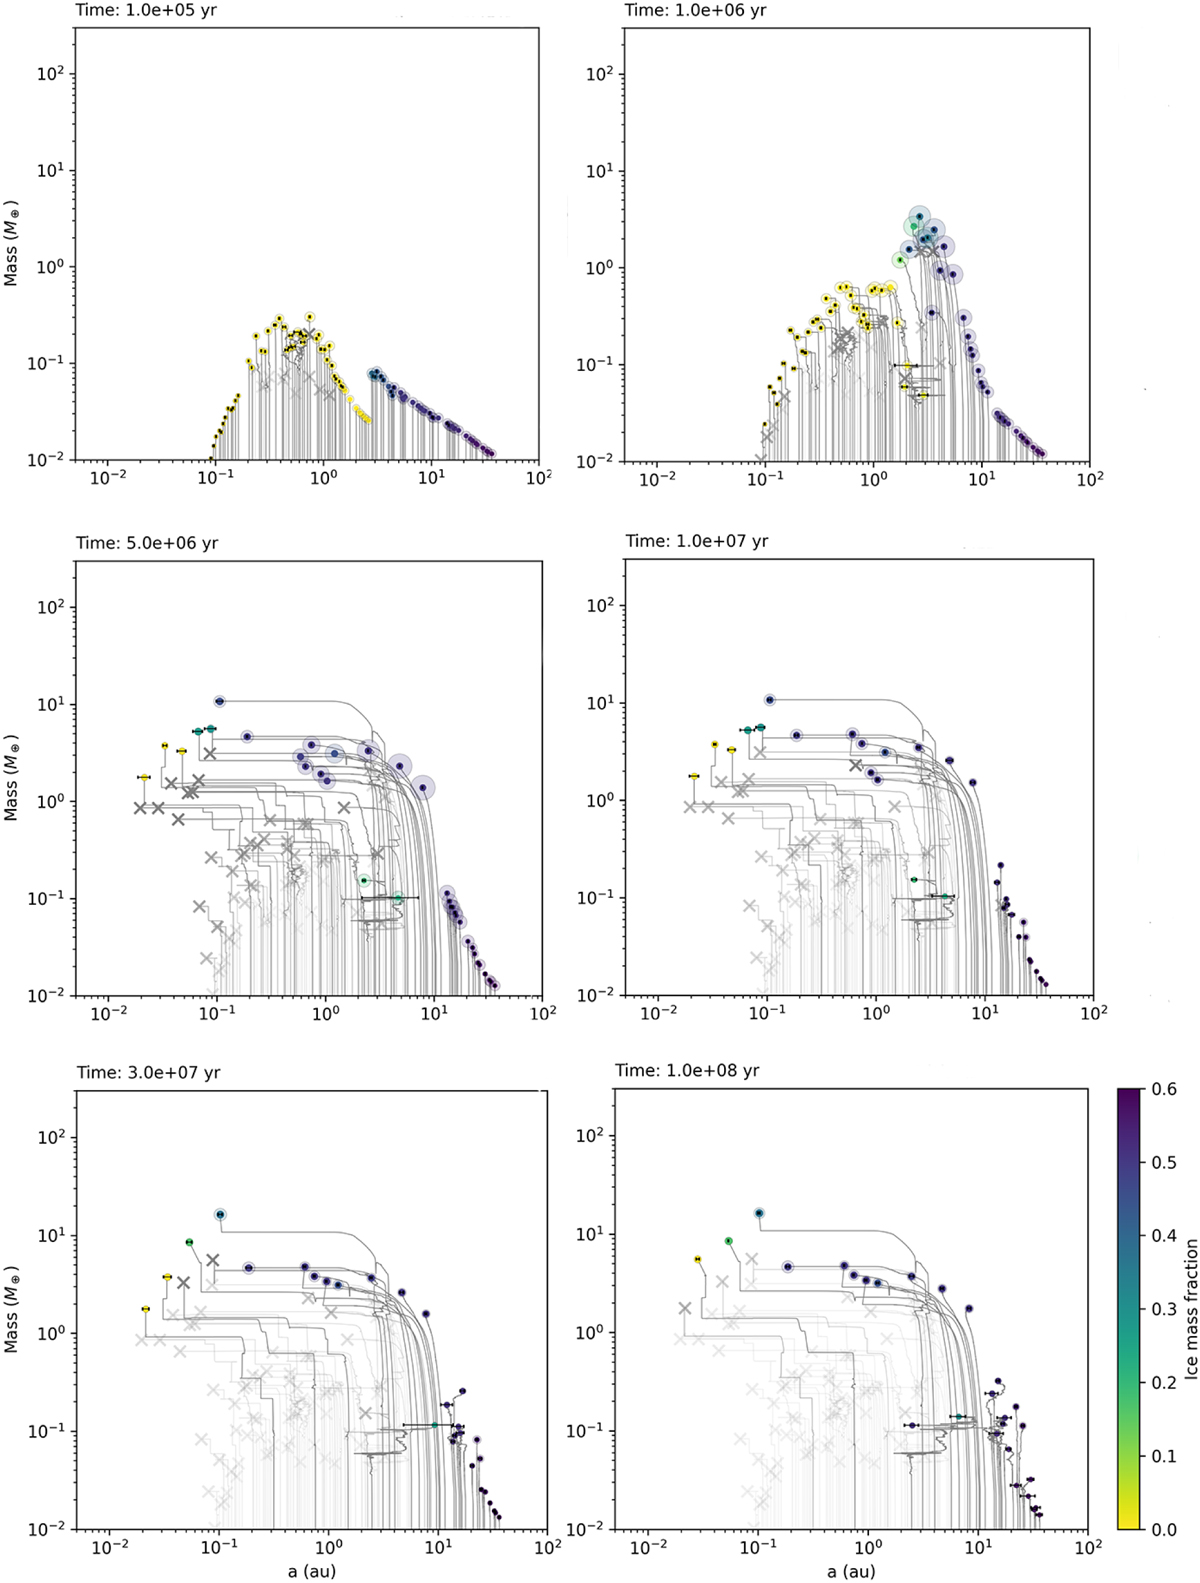
Fig. 4
Download original image
Example of the formation of a synthetic planetary system from initially 100 lunar-mass embryos in a typical protoplanetary disc with solar metallicity ([Fe/H] = 0.0). The epochs in time (in years) are shown in the top-left of the six panels. Solid points show (proto)planets with the semi-transparent part scaling with the radius. Grey crosses (fading in time) show the last position of protoplanets that were accreted by other more massive bodies. The colours of points represent the mass fraction of ice in the core. Horizontal black bars go from the periastron to the apoastron (i.e. represent orbital eccentricity). Lines show the growth tracks in the semi-major axis-mass plane.
Current usage metrics show cumulative count of Article Views (full-text article views including HTML views, PDF and ePub downloads, according to the available data) and Abstracts Views on Vision4Press platform.
Data correspond to usage on the plateform after 2015. The current usage metrics is available 48-96 hours after online publication and is updated daily on week days.
Initial download of the metrics may take a while.