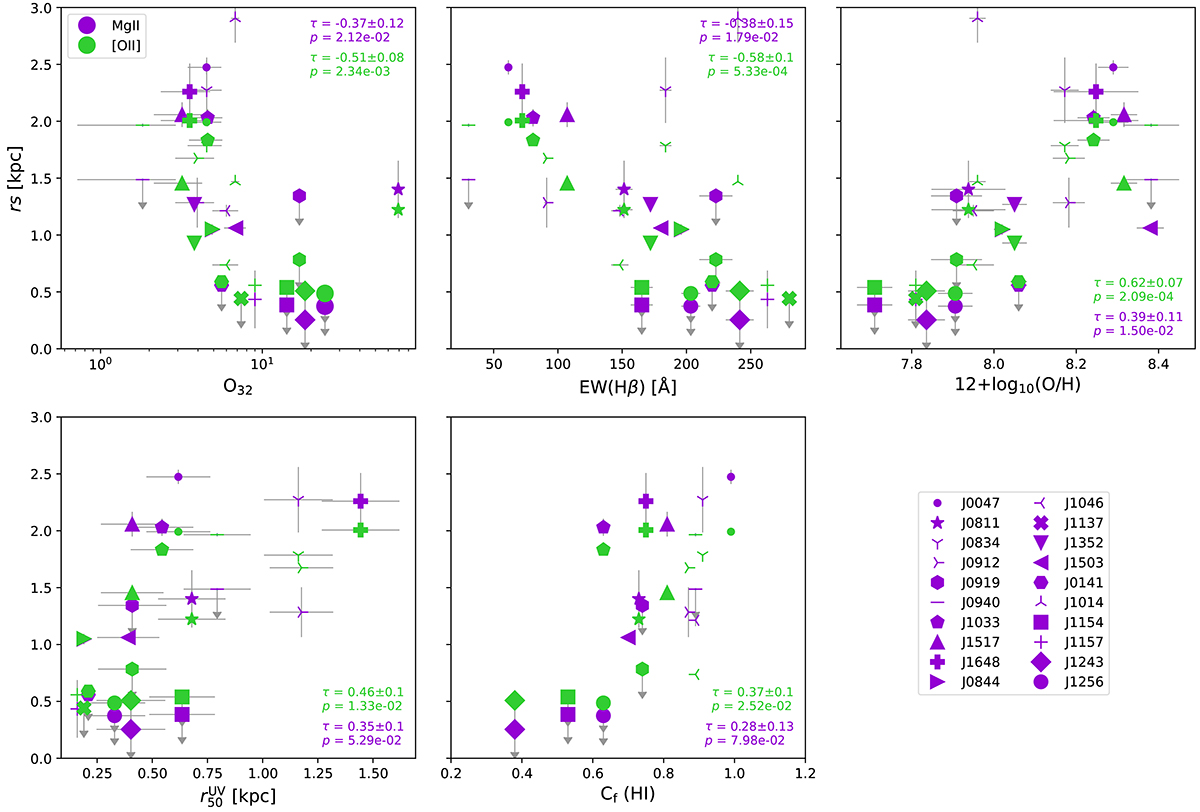
Fig. 9.
Download original image
Comparisons of the emission scale lengths (Mg II in purple and [O II] in green) and the O32 ratios (top left), Hβ equivalent widths (top middle), metallicities (top right), UV half-light radii (bottom left), and H I covering fractions (bottom right). Upper limit values are shown with arrows. The Kendall correlation coefficient (τ) for every pair of variables and the corresponding false-positive probability that the correlation is real (p) are given for both emission lines in the top right corners following the same color coding as the data points (Akritas & Siebert 1996; Flury et al. 2022b, see Sect. 3.4).
Current usage metrics show cumulative count of Article Views (full-text article views including HTML views, PDF and ePub downloads, according to the available data) and Abstracts Views on Vision4Press platform.
Data correspond to usage on the plateform after 2015. The current usage metrics is available 48-96 hours after online publication and is updated daily on week days.
Initial download of the metrics may take a while.