Fig. 7.
Download original image
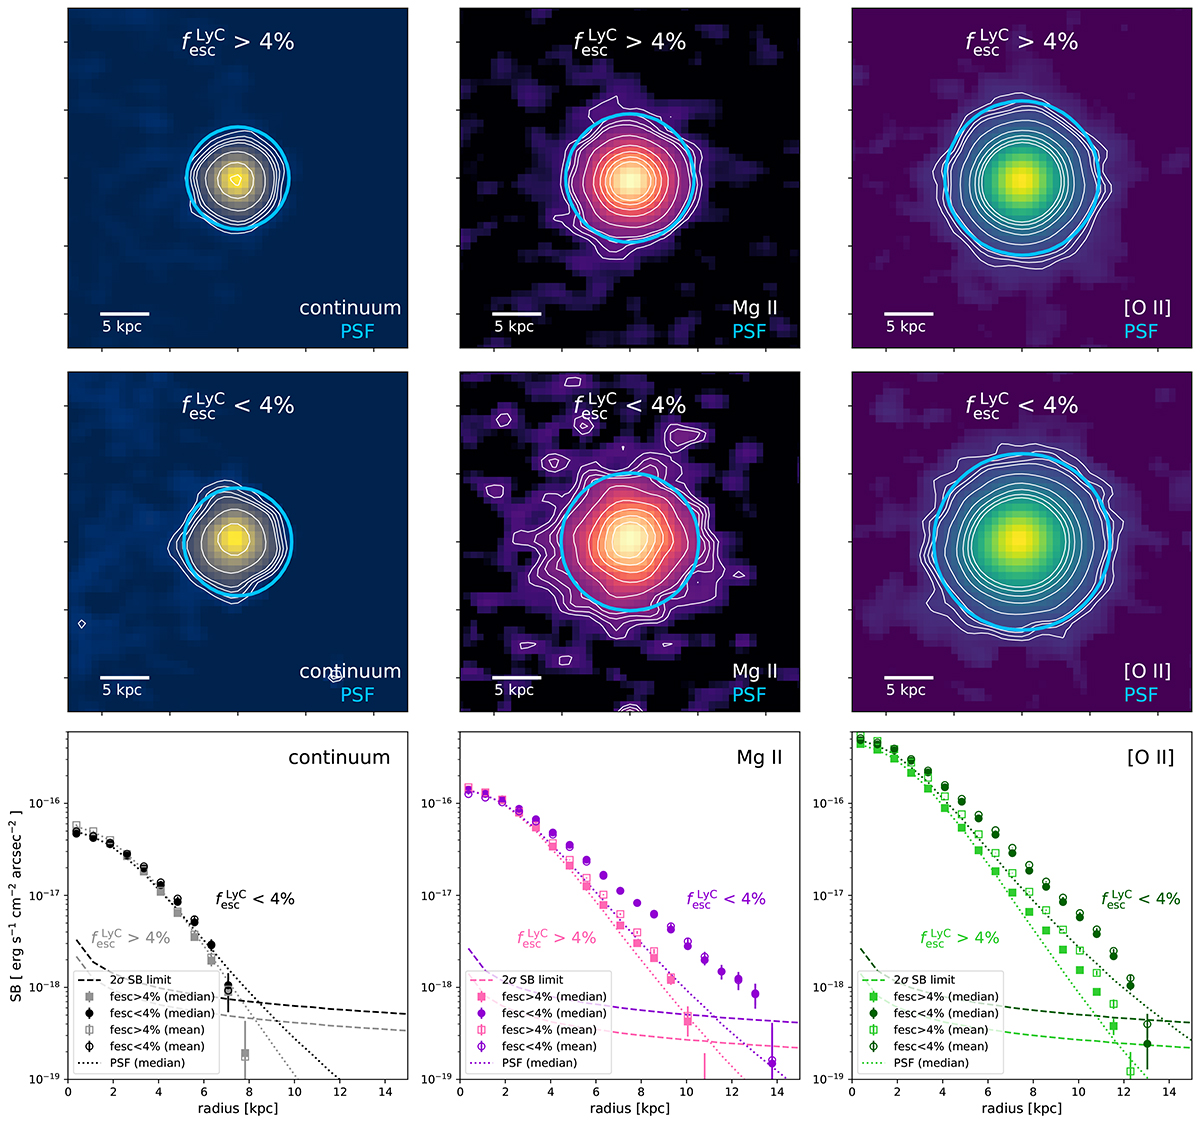
Composite images of our strong (![]() , top row) and non and weak (
, top row) and non and weak (![]() , middle row) LyC leakers observed with KCWI (see Sect. 4.3). The UV continuum, Mg II and [O II] mean stacks are shown from left to right, respectively. The contours are spaced logarithmically by 0.2 dex, with the lowest contour level always at 4 × 10⁻¹⁸ erg s−1 cm−2 arcsec−2. The bottom row compares the continuum (left), Mg II (middle) and [O II] (right) radial SB profiles of the two subsets composites images. In each bottom panels, the lighter (darker) colored profiles with square (circle) symbols correspond to the strong (non/weak) LyC leaker subsample. The full and empty markers show the profiles of the median and mean composite images, respectively. The dotted lines correspond to the SB profiles of the median stacked PSF images of the different subsamples. The dashed lines show the 2σ significance levels.
, middle row) LyC leakers observed with KCWI (see Sect. 4.3). The UV continuum, Mg II and [O II] mean stacks are shown from left to right, respectively. The contours are spaced logarithmically by 0.2 dex, with the lowest contour level always at 4 × 10⁻¹⁸ erg s−1 cm−2 arcsec−2. The bottom row compares the continuum (left), Mg II (middle) and [O II] (right) radial SB profiles of the two subsets composites images. In each bottom panels, the lighter (darker) colored profiles with square (circle) symbols correspond to the strong (non/weak) LyC leaker subsample. The full and empty markers show the profiles of the median and mean composite images, respectively. The dotted lines correspond to the SB profiles of the median stacked PSF images of the different subsamples. The dashed lines show the 2σ significance levels.
Current usage metrics show cumulative count of Article Views (full-text article views including HTML views, PDF and ePub downloads, according to the available data) and Abstracts Views on Vision4Press platform.
Data correspond to usage on the plateform after 2015. The current usage metrics is available 48-96 hours after online publication and is updated daily on week days.
Initial download of the metrics may take a while.