Fig. 4.
Download original image
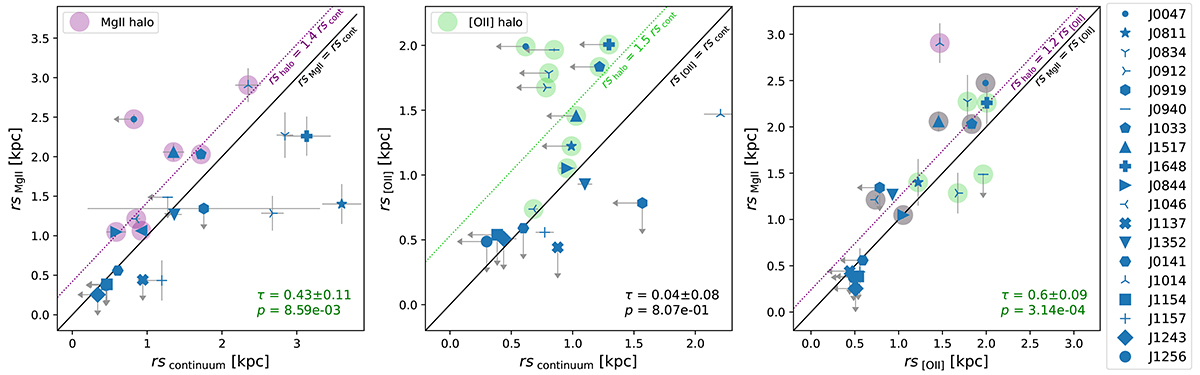
Comparisons of the spatial scale lengths (rs) as measured in Sect. 3.3: Mg II and continuum (left), [O II] and continuum (middle), and Mg II and [O II] (right). Objects with statistically significant Mg II and [O II] extended emission compared to continuum are indicated by large purple and green symbols, respectively (Sect. 3.4). Gray symbols in the right panel result in the overlap of the purple and green symbols and thus indicate that both Mg II and [O II] halos are detected. The dotted lines show by how much on average the emission is statistically more extended compared to the continuum (or emission) scale lengths: median ∼1.4 times for Mg II and ∼1.5 times for [O II] compared to the continuum, and 1.2 for the Mg II/[O II] ratio. The black line shows the 1:1 relation (i.e., no extended emission). Upper/lower limit values are shown with arrows. The Kendall correlation coefficient (τ) for every pair of variables and the corresponding false-positive probability that the correlation is real (p) are given and colored in green if the correlation is > 2σ statistically significant (Akritas & Siebert 1996; Flury et al. 2022b, see Sect. 3.4).
Current usage metrics show cumulative count of Article Views (full-text article views including HTML views, PDF and ePub downloads, according to the available data) and Abstracts Views on Vision4Press platform.
Data correspond to usage on the plateform after 2015. The current usage metrics is available 48-96 hours after online publication and is updated daily on week days.
Initial download of the metrics may take a while.