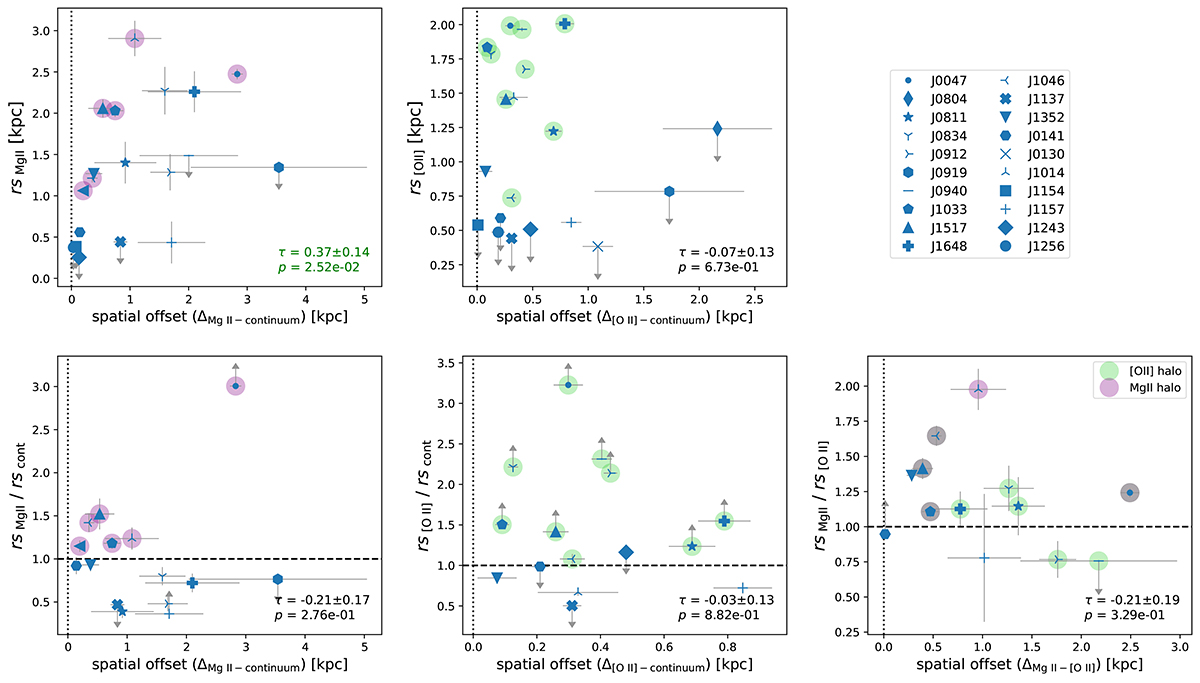
Fig. D.1.
Download original image
Relation between the Mg II and [O II] spatial extent and offset measured for our sample. Top left (right): Mg II ([O II]) exponential scale length plotted as a function of the Mg II ([O II]) spatial offset relative to the continuum. Bottom left (middle): Ratio between the Mg II ([O II]) and continuum scale length versus the Mg II ([O II]) spatial offset relative to the continuum. Bottom right: Ratio between the Mg II and [O II] scale length versus the Mg II spatial offset relative to the [O II] emission. The Kendall correlation coefficient (τ) and the corresponding probability that the correlation is real (p) are given and colored in green if the correlation is statistically significant (Akritas & Siebert 1996; Flury et al. 2022b, see Sect. 3.4). Objects with statistically significant Mg II and [O II] extended emission are indicated by large purple and green symbols, respectively (Sect. 3.4).
Current usage metrics show cumulative count of Article Views (full-text article views including HTML views, PDF and ePub downloads, according to the available data) and Abstracts Views on Vision4Press platform.
Data correspond to usage on the plateform after 2015. The current usage metrics is available 48-96 hours after online publication and is updated daily on week days.
Initial download of the metrics may take a while.