Fig. 2.
Download original image
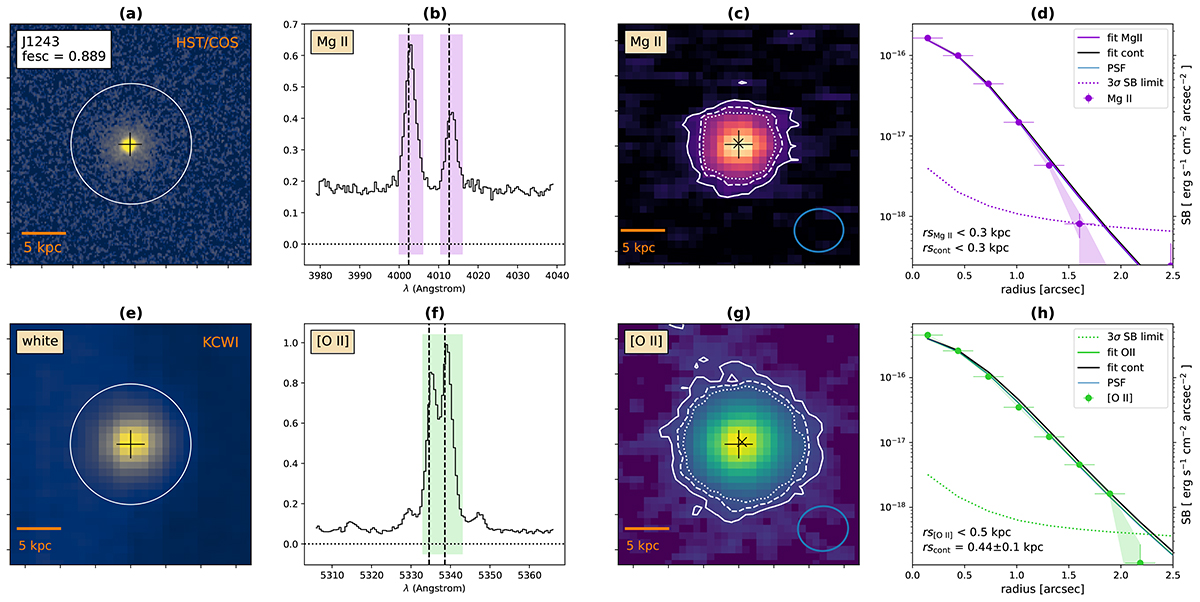
Example of a LyC leaking source (J1243+4646, ![]() ) from our sample observed with KCWI. (a) 5″ × 5″ HST/COS acquisition image (when available) plotted with a power-law stretch. The circle indicates the 2
) from our sample observed with KCWI. (a) 5″ × 5″ HST/COS acquisition image (when available) plotted with a power-law stretch. The circle indicates the 2![]() 5 COS spectroscopic aperture (diameter). This aperture is also shown on the white light image e and was used to integrate the spectrum shown in panels b and f for comparison. (b) Observed Mg II line doublet extracted in a 2
5 COS spectroscopic aperture (diameter). This aperture is also shown on the white light image e and was used to integrate the spectrum shown in panels b and f for comparison. (b) Observed Mg II line doublet extracted in a 2![]() 5 aperture (units of erg s−1 cm−2 Å−1). The purple areas show the narrow band (NB) image spectral coverage. The vertical lines indicate the systemic redshift from Flury et al. (2022a) and Izotov et al. (2022). (c) 5″ × 5″ Mg II NB image plotted with a power-law stretch. The white contours correspond to Mg II significance levels of 3, 6 and 9σ (solid, dashed, and dotted, respectively). The blue circle shows the PSF FWHM estimated at Mg II wavelengths. The “+” and “x” symbols show the best-fit centroids of the emission line and nearby continuum, respectively. If neighboring sources were masked for the analysis, the mask is shown with an orange contour. (d) Radial surface brightness (SB) profiles of the observed and modeled Mg II emission (purple dots and line, resp.) compared to the modeled continuum (black) and PSF (blue) estimated at Mg II wavelengths. If the source is unresolved, the blue and black lines are under the purple or green line. The 3σ SB limit is shown as a dotted line. The shaded area represents the 1σ uncertainties from bootstrapping analysis. The horizontal error bars corresponds to the annulus width used to build the profiles. (e) IFU white light image. (f) [O II] line doublet (units of erg s−1 cm−2 Å−1). (g) Same as (c) for [O II]. (h) Same as (d) for [O II].
5 aperture (units of erg s−1 cm−2 Å−1). The purple areas show the narrow band (NB) image spectral coverage. The vertical lines indicate the systemic redshift from Flury et al. (2022a) and Izotov et al. (2022). (c) 5″ × 5″ Mg II NB image plotted with a power-law stretch. The white contours correspond to Mg II significance levels of 3, 6 and 9σ (solid, dashed, and dotted, respectively). The blue circle shows the PSF FWHM estimated at Mg II wavelengths. The “+” and “x” symbols show the best-fit centroids of the emission line and nearby continuum, respectively. If neighboring sources were masked for the analysis, the mask is shown with an orange contour. (d) Radial surface brightness (SB) profiles of the observed and modeled Mg II emission (purple dots and line, resp.) compared to the modeled continuum (black) and PSF (blue) estimated at Mg II wavelengths. If the source is unresolved, the blue and black lines are under the purple or green line. The 3σ SB limit is shown as a dotted line. The shaded area represents the 1σ uncertainties from bootstrapping analysis. The horizontal error bars corresponds to the annulus width used to build the profiles. (e) IFU white light image. (f) [O II] line doublet (units of erg s−1 cm−2 Å−1). (g) Same as (c) for [O II]. (h) Same as (d) for [O II].
Current usage metrics show cumulative count of Article Views (full-text article views including HTML views, PDF and ePub downloads, according to the available data) and Abstracts Views on Vision4Press platform.
Data correspond to usage on the plateform after 2015. The current usage metrics is available 48-96 hours after online publication and is updated daily on week days.
Initial download of the metrics may take a while.