Fig. B.4.
Download original image
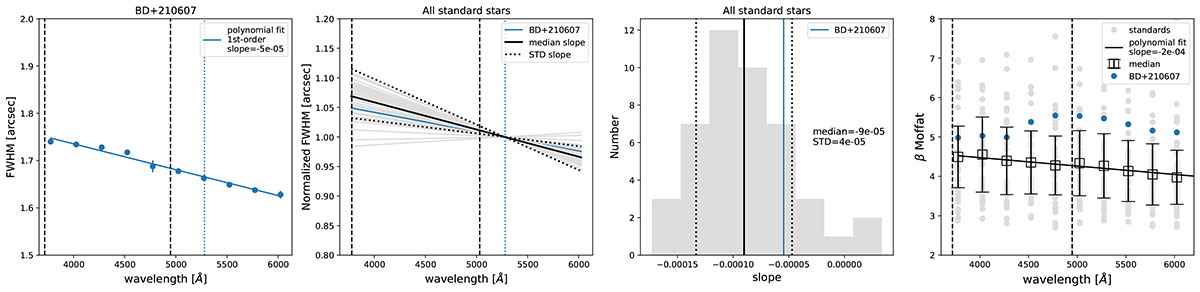
First panel: Evolution of the PSF FWHM with wavelength for the standard star BD+210607 observed with LRS2. The vertical dashed line indicate the Mg II and [O II] wavelengths of the science object J080425+472607. The vertical dotted blue line corresponds to the central wavelength of LRS2B (≈ 5300 Å). The solid blue line shows the best first-order polynomial fit to the data. The resulting slope is −9 × 10⁻⁵ which is consistent with the average value obtained from all the standard stars (middle and right panels). Second panel: Best first-order polynomial fits of the PSF FWHM – wavelength relation of all the standard stars (gray). The relation resulting from the median slope and the standard deviation is shown with solid and dotted black line, respectively. Third panel: Distribution of the slope measured on the standard stars. The solid and dotted vertical lines indicate the median and standard deviation of the distribution (values on middle right), respectively. Fourth panel: Evolution of the Moffat β parameter with wavelength for all the standard stars (gray). The empty squares and corresponding errorbars give the median value and median absolute deviation in each wavelength bin. The blue dots show the BD+210607 values.
Current usage metrics show cumulative count of Article Views (full-text article views including HTML views, PDF and ePub downloads, according to the available data) and Abstracts Views on Vision4Press platform.
Data correspond to usage on the plateform after 2015. The current usage metrics is available 48-96 hours after online publication and is updated daily on week days.
Initial download of the metrics may take a while.