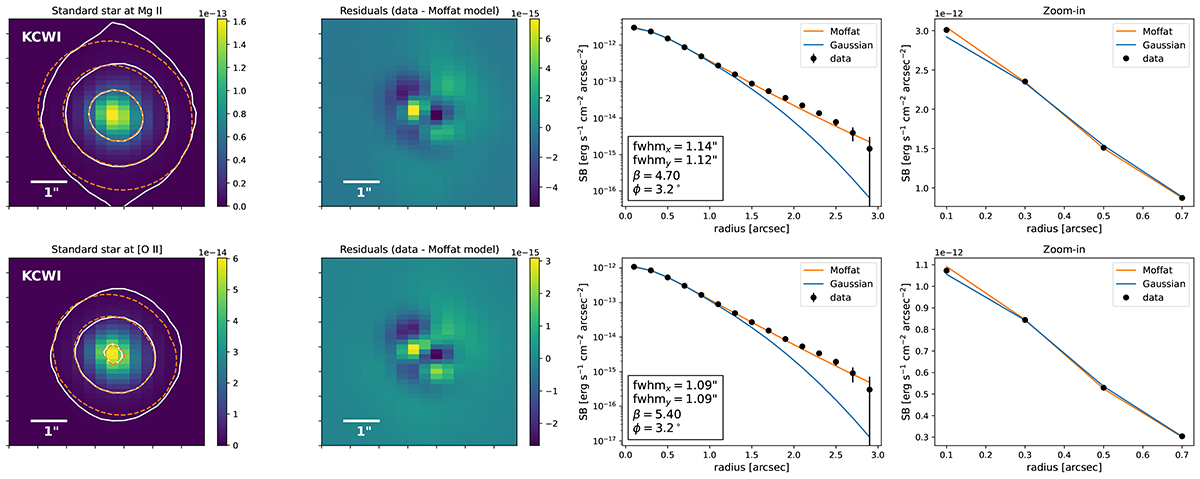
Fig. B.1.
Download original image
Characterization of the KCWI point spread function. Example for the standard star (Feige66) where the first and second rows show the size measurement at Mg II (≈ 3790 Å) and [O II] (≈ 5045 Å) wavelengths of the corresponding science object observed (J1256+4509), respectively. First panel: Narrow-band image at the wavelengths of interest (≈ 1000 km s−1 wide or 13 Å at z = 0.35). The white and orange contours corresponds to SB levels of 10−14, 10−13, and 10−12 erg s−1 cm−2 arcsec−2 for the data and Moffat best-fit model, respectively. Second panel: Fit residuals of the Moffat best-fit model. Third panel: Radial SB profiles of the standard star data (black), Gaussian best-fit model (blue) and Moffat best-fit model (orange). The best-fit model parameters are shown in the bottom left. Forth panel: Zoom-in on the inner profiles. A Moffat model better describes both the core and wings of the PSF for our KCWI observations.
Current usage metrics show cumulative count of Article Views (full-text article views including HTML views, PDF and ePub downloads, according to the available data) and Abstracts Views on Vision4Press platform.
Data correspond to usage on the plateform after 2015. The current usage metrics is available 48-96 hours after online publication and is updated daily on week days.
Initial download of the metrics may take a while.