Fig. 1.
Download original image
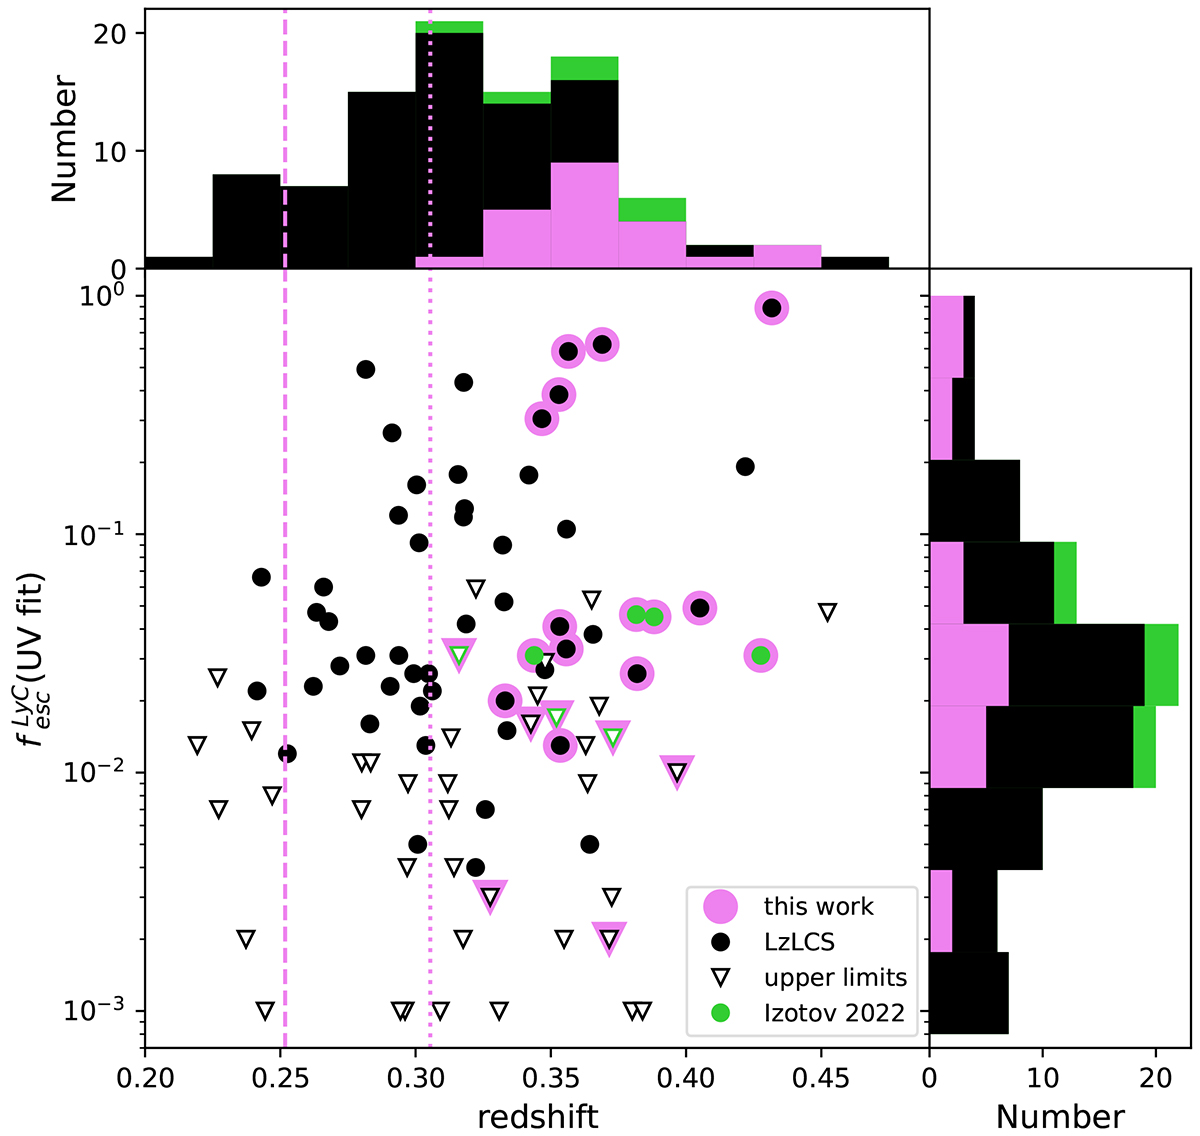
Selection of our diverse sample of LyC leakers (pink) from the Izotov et al. (2022, green) and LzLCS+ (black; Izotov et al. 2016a,b, 2018a,b, 2021; Wang et al. 2019; Flury et al. 2022a) samples. The x- and y- axis show the redshift and LyC escape fraction derived in the literature from fitting the COS UV spectrum, respectively (see Sect. 2.1). The triangle symbols show the ![]() upper limits for the different samples. The dashed and dotted lines indicate the redshift corresponding to the wavelength cutoff of KCWI (λ = 3500 Å) and LRS2 (λ = 3650 Å), respectively. We show the redshift and
upper limits for the different samples. The dashed and dotted lines indicate the redshift corresponding to the wavelength cutoff of KCWI (λ = 3500 Å) and LRS2 (λ = 3650 Å), respectively. We show the redshift and ![]() distributions at the top and right of the figure, respectively.
distributions at the top and right of the figure, respectively.
Current usage metrics show cumulative count of Article Views (full-text article views including HTML views, PDF and ePub downloads, according to the available data) and Abstracts Views on Vision4Press platform.
Data correspond to usage on the plateform after 2015. The current usage metrics is available 48-96 hours after online publication and is updated daily on week days.
Initial download of the metrics may take a while.