Fig. 2.
Download original image
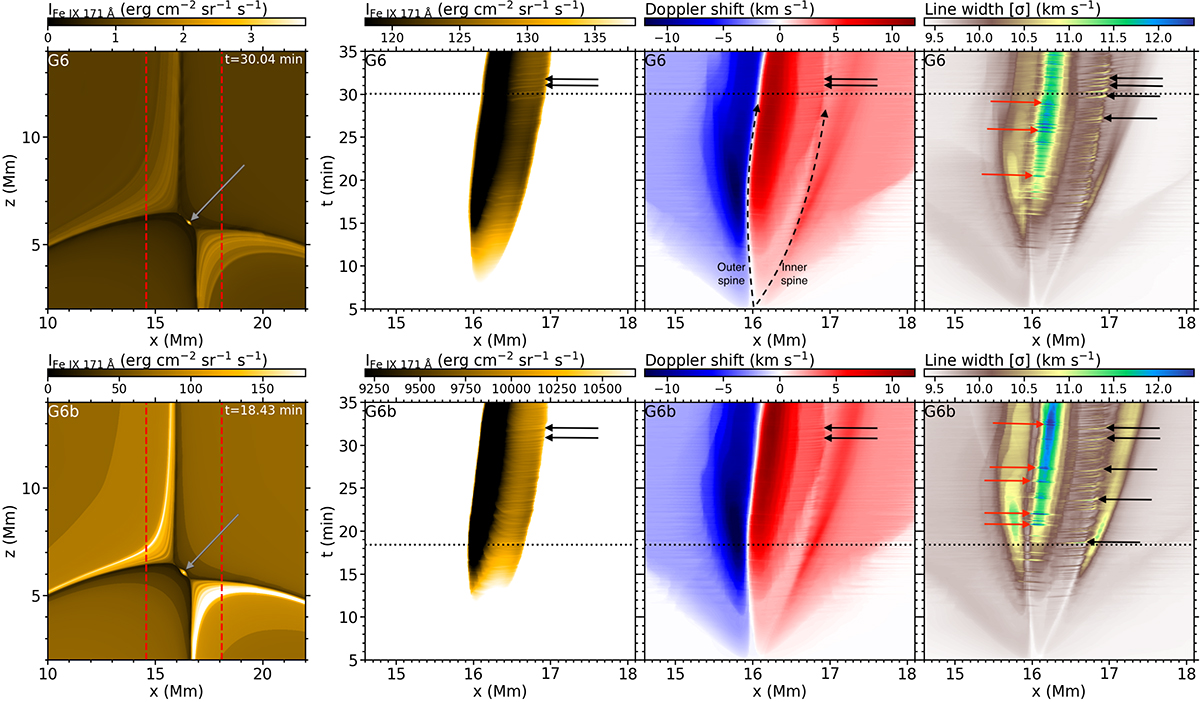
Synthetic spectral moments of the Fe IX 171 Å line with no instrumental effects for the simulations G6 (top) and G6b (bottom). The first column contains the off-limb intensity at a given time. The other three columns show the on-disk observables for the intensity, Doppler shift, and line width, respectively, as functions of x and t. The red dashed lines in the first column delimit the x range shown in the other three columns. The black dotted lines on the latter three columns mark the time illustrated in the first column. The solid arrows point at the location of some plasmoids: red ones for those upward-moving; black or grey for downward-moving. The dashed (curved) arrows mark the inner an outer spine location (upper third panel only). A movie of the full-time evolution of the figure for t ∈ [0, 40] min is available online.
Current usage metrics show cumulative count of Article Views (full-text article views including HTML views, PDF and ePub downloads, according to the available data) and Abstracts Views on Vision4Press platform.
Data correspond to usage on the plateform after 2015. The current usage metrics is available 48-96 hours after online publication and is updated daily on week days.
Initial download of the metrics may take a while.