Fig. 11.
Download original image
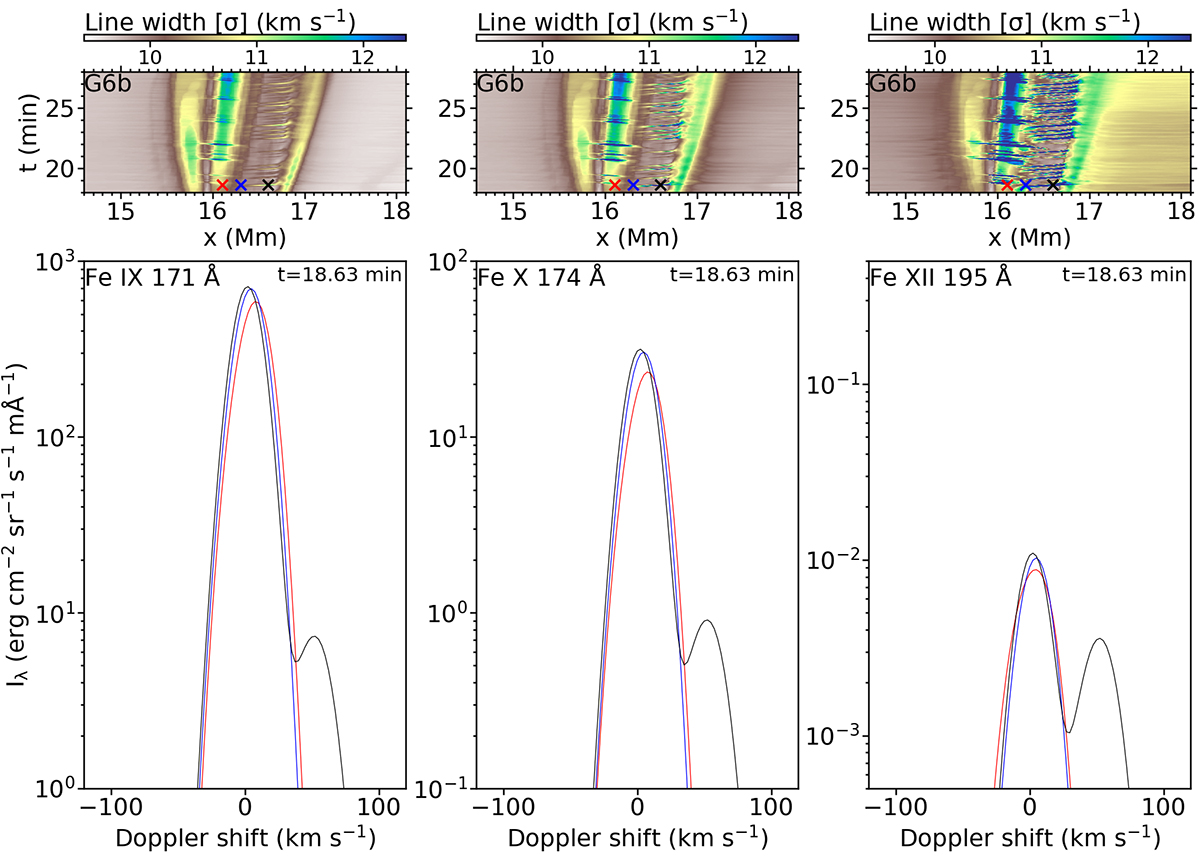
Spectral line profiles for the Fe IX 171 Å, Fe X 174 Å, and Fe X 174 Å lines without instrumental effects, taken from case G6b with z-axis as LOS, at selected positions along x-axis. For context, the top panels show maps of the line width against x and time, where the “x”’s mark the positions from where the corresponding line profiles with the same color (in the bottom panels) are taken. A movie of the time evolution for t ∈ [18, 23] min is available online.
Current usage metrics show cumulative count of Article Views (full-text article views including HTML views, PDF and ePub downloads, according to the available data) and Abstracts Views on Vision4Press platform.
Data correspond to usage on the plateform after 2015. The current usage metrics is available 48-96 hours after online publication and is updated daily on week days.
Initial download of the metrics may take a while.