Fig. 2
Download original image
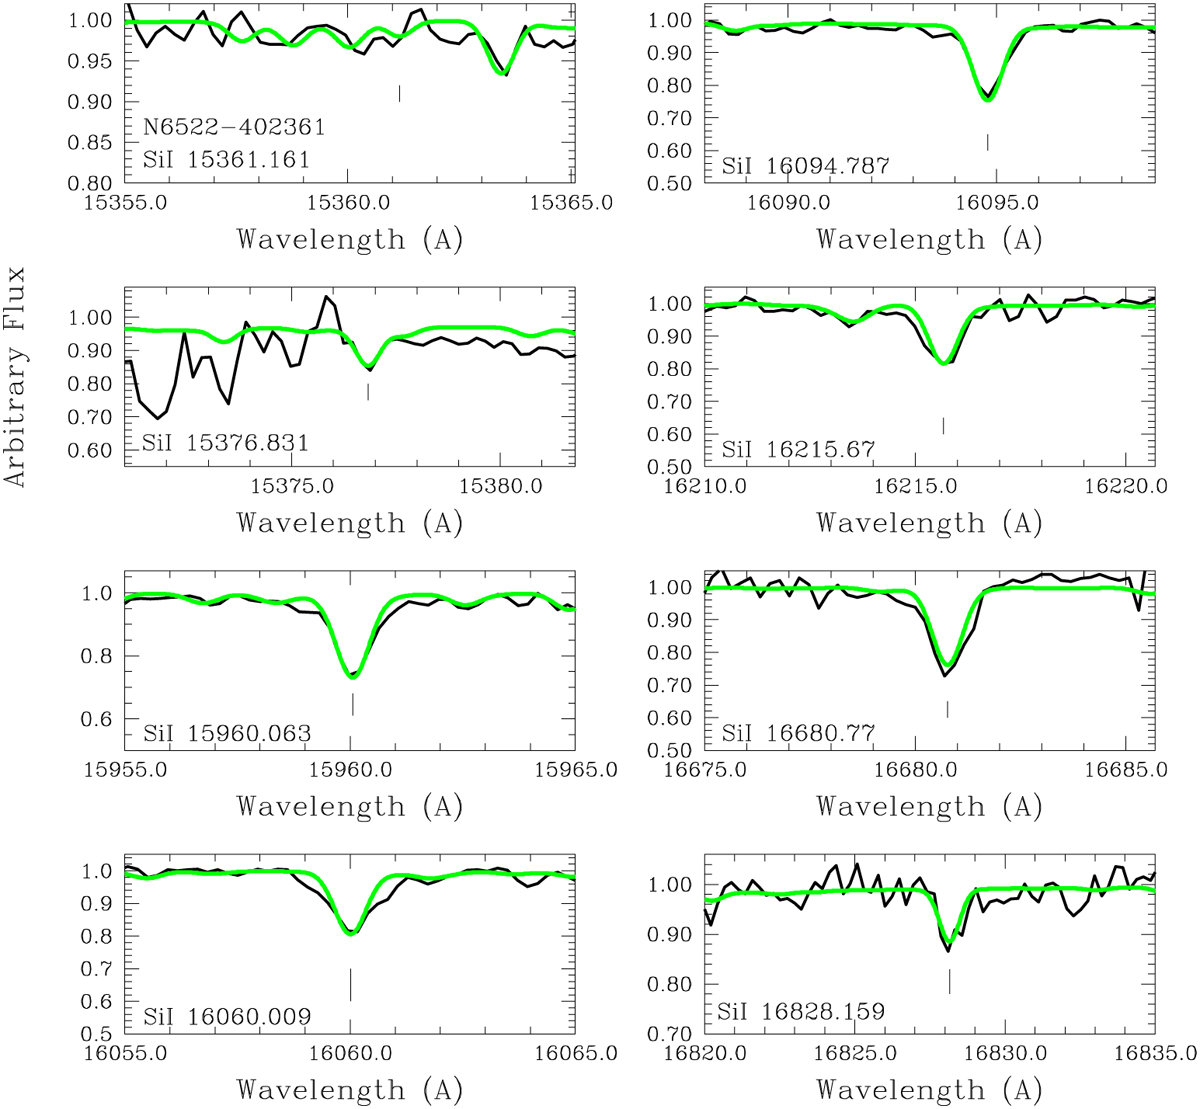
H-band Si I lines shown for the star NGC 6522-402361. The APOGEE observed spectrum (black line) is compared with synthetic spectra computed adopting the UVES stellar parameters and [Si/Fe] = +0.30 (green lines).
Current usage metrics show cumulative count of Article Views (full-text article views including HTML views, PDF and ePub downloads, according to the available data) and Abstracts Views on Vision4Press platform.
Data correspond to usage on the plateform after 2015. The current usage metrics is available 48-96 hours after online publication and is updated daily on week days.
Initial download of the metrics may take a while.