Open Access
Fig. B.1
Download original image
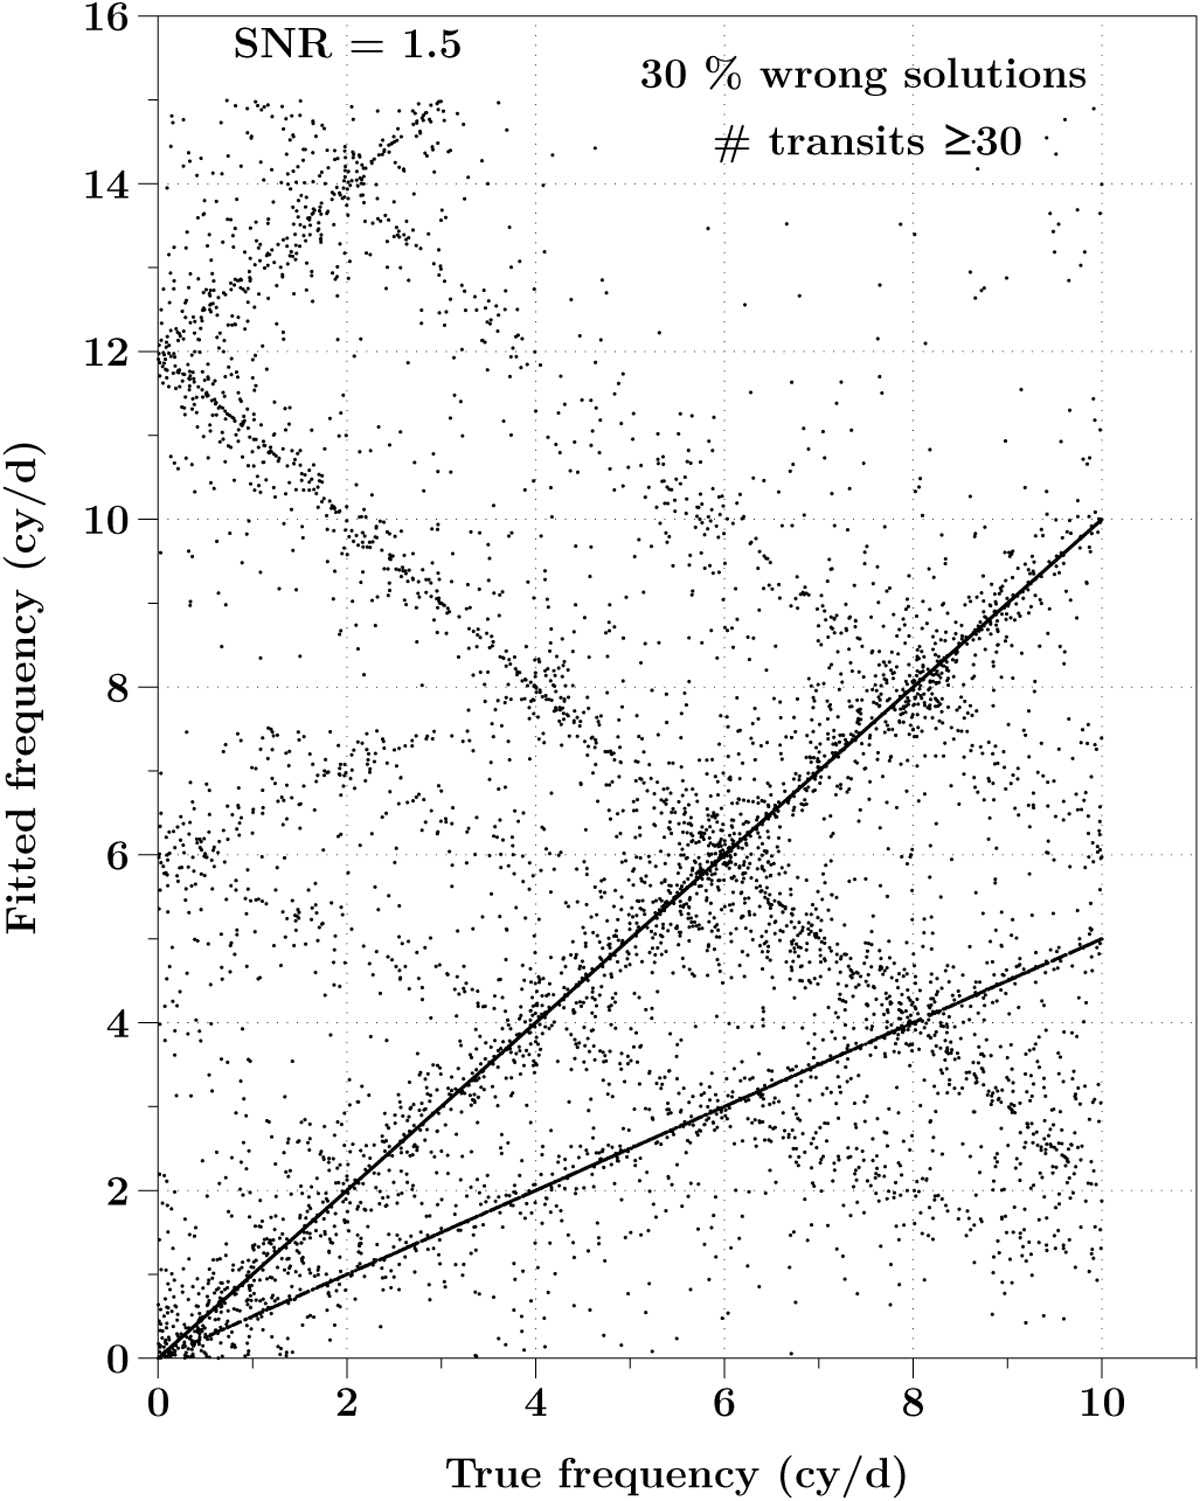
Retrieved frequencies of a simulated periodic signal sampled with Gaia repeated visits on different regions of the sky. The noise is at a S/N = 1.5 in this example. 70% of the solutions come out with the correct frequency and the remainder is divided between the 1/2 undertone and aliases.
Current usage metrics show cumulative count of Article Views (full-text article views including HTML views, PDF and ePub downloads, according to the available data) and Abstracts Views on Vision4Press platform.
Data correspond to usage on the plateform after 2015. The current usage metrics is available 48-96 hours after online publication and is updated daily on week days.
Initial download of the metrics may take a while.