Fig. 2
Download original image
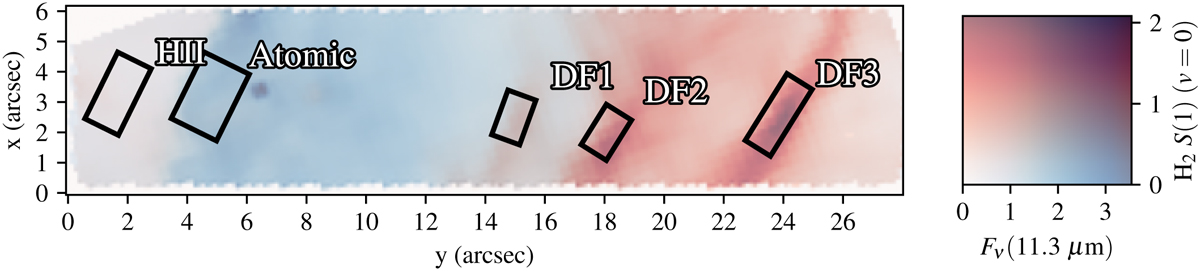
Apertures from which the five template spectra were extracted, overlayed on two slices of the MIRI MRS data cube. The horizontal axis is aligned with the y-coordinate of the IFU and the 9×1 mosaic strip. The blue component is the total flux at 11.3 µm (104 MJy sr−1), which contains some continuum, but mainly traces the 11.3 µm AIB and peaks in the atomic region. The red component highlights the locations of the dissociation fronts using the intensity of the H2 S (1) line at 17.0 µm(10−3 erg s−1 cm−2 sr−1). The two-dimensional color legend shows where one component (red and blue) or both components (dark purple) are bright.
Current usage metrics show cumulative count of Article Views (full-text article views including HTML views, PDF and ePub downloads, according to the available data) and Abstracts Views on Vision4Press platform.
Data correspond to usage on the plateform after 2015. The current usage metrics is available 48-96 hours after online publication and is updated daily on week days.
Initial download of the metrics may take a while.