Fig. 1
Download original image
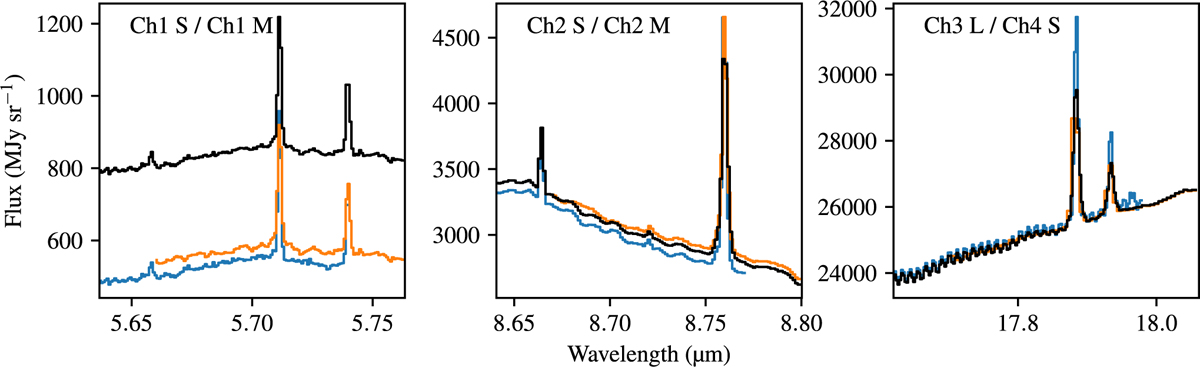
Examples of flux differences in overlapping regions between MIRI bands. Blue and orange curves show individual segments, with the bands indicated at the top of each panel. These were extracted from the band cubes produced by the pipeline, in this example for the H II template aperture. The black line shows the stitched spectrum, which is offset with respect to the blue and orange lines due to the additive offsets applied to the 12 segments, which are cumulative with Ch 2 LONG used as a reference.
Current usage metrics show cumulative count of Article Views (full-text article views including HTML views, PDF and ePub downloads, according to the available data) and Abstracts Views on Vision4Press platform.
Data correspond to usage on the plateform after 2015. The current usage metrics is available 48-96 hours after online publication and is updated daily on week days.
Initial download of the metrics may take a while.