Fig. 7.
Download original image
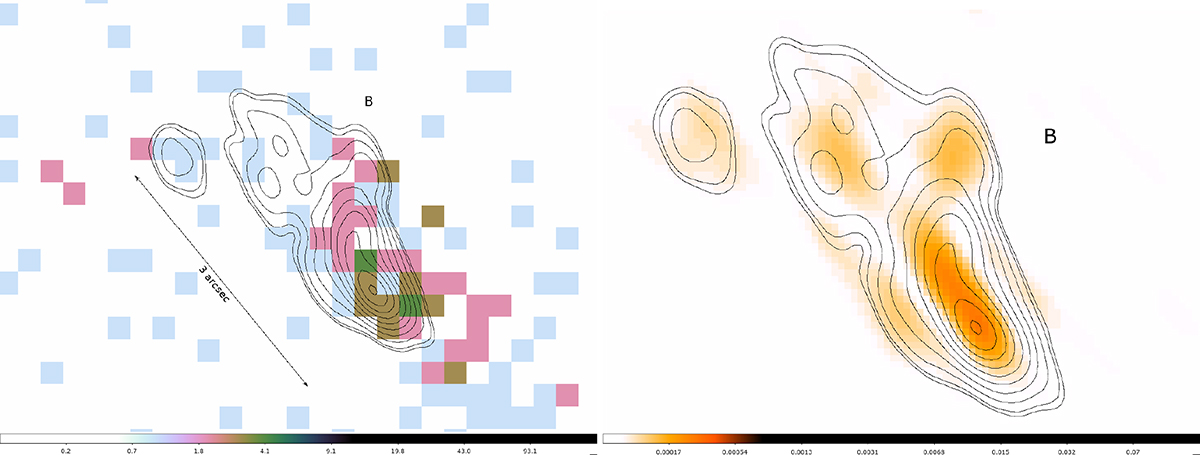
Images of knot B. Left: ACIS-S 0.5–7 keV mosaic image of knot B binned to 0.249″ pixels. The color map shows the number of counts per image pixel. The contours are 6 GHz VLA data starting at 0.075 mJy beam−1 with a ![]() scale. The arrow marks a 3″ scale size. Right: C-band polarization map with the 6 GHz radio intensity contours, as on the left. The color bar shows the polarization, with orange marking the strong linear polarization.
scale. The arrow marks a 3″ scale size. Right: C-band polarization map with the 6 GHz radio intensity contours, as on the left. The color bar shows the polarization, with orange marking the strong linear polarization.
Current usage metrics show cumulative count of Article Views (full-text article views including HTML views, PDF and ePub downloads, according to the available data) and Abstracts Views on Vision4Press platform.
Data correspond to usage on the plateform after 2015. The current usage metrics is available 48-96 hours after online publication and is updated daily on week days.
Initial download of the metrics may take a while.