Fig. 5.
Download original image
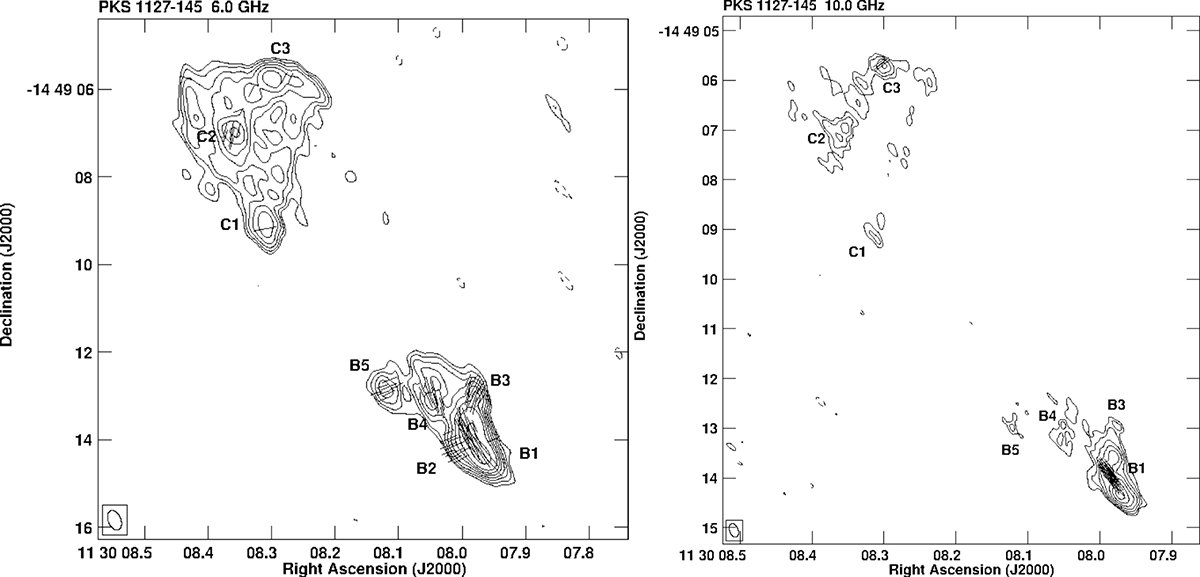
VLA total intensity images of the outer regions of PKS 1127−145 at 6 GHz (left) and 10 GHz (right). The first contour is 0.05 and 0.045 mJy beam−1 at 6 and 10 GHz, respectively, and corresponds to three times the off-source noise level measured far from the core region. Contours are drawn at [−1,1,1.4,2,2.8,4,5.6,8,16,32,...] times the first contour. Vectors superimposed on the total intensity contours show the PA of the electric vector, where 0.5-arcsec length corresponds to 0.1 and 0.08 mJy beam−1 (polarization intensity) at 6 and 10 GHz, respectively.
Current usage metrics show cumulative count of Article Views (full-text article views including HTML views, PDF and ePub downloads, according to the available data) and Abstracts Views on Vision4Press platform.
Data correspond to usage on the plateform after 2015. The current usage metrics is available 48-96 hours after online publication and is updated daily on week days.
Initial download of the metrics may take a while.